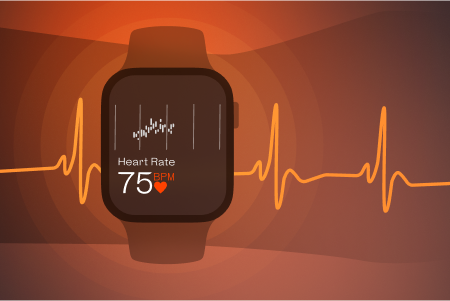
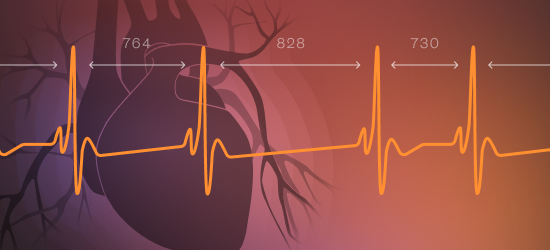
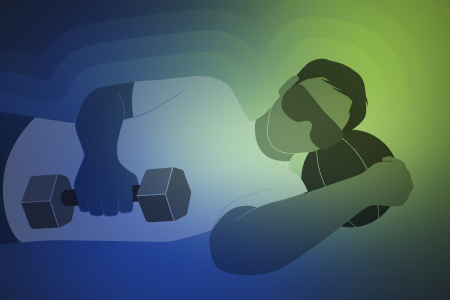
close
welltory logo

Welltory is the Ultimate HRV App

qr-code__downloads-app
qr-code__ratings-app
qr-code__reviews-app
qr-code__get-app

RMSSD and other HRV metrics

Table of Contents

Heart Rate Variability (HRV) is a tool used by doctors, scientists, and regular people to understand how our bodies handle stress, i.e., how well our bodies respond to changes in our environment. 

HRV looks at the small changes in time between our heartbeats. These variations in time intervals are called R-R intervals and are measured in milliseconds. Once analyzed, HRV can tell you a lot about how your body is coping, whether it’s susceptible to illness, and even how well you can focus.

There are many methods to calculate and analyze HRV, including RMSSD, and we’ll get into them below. There’s a lot of science to unpack, and if you’re new to HRV, it’s understandable if the calculations don’t fully land. Whether you’re a science wiz or just diving in, if you want to use HRV to stay on top of your health, just download Welltory and take measurements regularly. We’ll analyze your results, give you recommendations, and even provide charts you can show your doctor.

The most common HRV calculations

Two main formulas are used to calculate HRV: RMSSD and SDNN. Let’s take a deeper look at how they’re calculated, how they’re interpreted, and what makes them so reliable.

Comparison of four different HRV measurements:

RMSSD - the root mean square of successive differences

RMSSD is a standard statistical measure of HRV. It stands for the root mean square of successive differences. RMSSD HRV measures the time difference between each successive heartbeat in real-time to arrive at your RMSSD score, meaning you can see the result at the exact moment. This formula is helpful for investigating the impact of training loads and recovery processes, for example. This kind of statistical analysis helps us find patterns in big data sets and transforms a list of numbers into valuable health information.

Researchers have proposed the following HRV RMSSD normal ranges in different studies:

  • 19 – 48 ms — healthy adults in the age group of 38 – 42 years
  • 35 – 107 ms — elite athletes
RMSSD HRV chart

What is a good RMSSD score?

These standard ranges vary considerably, and if we tried to unify them, the reference range for RMSSD would be 19 – 107 ms, which seems like a pretty broad generalization. Welltory uses the healthy HRV levels’ reference range of 20–89 ms. Even though it’s possible to get an RMSSD score that falls out of our range, it would most likely mean that your body is working overtime and is under a lot of pressure. 

The same generalization issue happens with other not-so-common HRV scores like SDANN, pNN50, or Amo50. They are too broad to be useful for everyday measurements because heart rate variability is an extremely sensitive metric. Differences in the timing and duration of the measurement also affect the results. 

Get Welltory
to track HRV

Get Welltory
to track HRV

Personalized HRV charts
Science-backed metrics
AI-driven health insights
Scan QR code to get Welltory app now

What is a bad RMSSD score?

RMSSD scores below 16 or above 107 ms are worth paying attention to. A low or high RMSSD score doesn’t necessarily mean there’s something to worry about, but it’s a good idea to keep an eye on and bring it to your doctor’s attention. 

When it comes to high HRV, many reasons can cause a spike in your heart rate and HRV. 2019 research found an interesting correlation between negative news and an increase in RMSSD. It suggests that the average person has a stronger physiological response to negative rather than positive news stories. Participants exhibited higher variability in heart rate during negative news stories than positive news stories. 

Why do we use RMSSD?

An important feature of RMSSD is that it characterizes short-term rapid changes in heart rate, which can only occur under the influence of the parasympathetic nervous system.

This makes RMSSD the main parameter that we can use to evaluate the work of a person’s parasympathetic system. Researchers agree that RMSDD is a measure of vagus-mediated control of the heart. 

Assessing parasympathetic regulation is crucial because only the vagus nerve provides a ‘protective’ effect for the heart. In general, insufficient vagal activity usually goes under the radar. A person with low RMSSD may not feel sick or tired, but these low values ​​can have negative consequences during a medical emergency. The activity of the vagus nerve decreases heart rate, increases blood flow to the heart, and stabilizes the myocardium to prevent ventricular fibrillation. In any condition accompanied by hypoxia (epilepsy, respiratory failure, pneumonia), the protective function of the vagus nerve becomes even more critical as it allows the heart to provide a sufficient blood supply. 

That’s why it is important to assess the performance of the parasympathetic system and analyze HRV, taking into account rapidly changing metrics.

SDNN - the standard deviation of NN intervals

SDNN is a measure of HRV that calculates the average value of HRV in milliseconds and shows how far your HRV is from that average at any point in the day. Although it is often calculated in a 24-hour period, it can be calculated over short periods too, which is what we do at Welltory.

The SDNN is considered the “gold standard” for medical stratification of cardiac risk. SDNN values predict both morbidity and mortality.

There are optimal healthy HRV range thresholds for SDNN HRV measure: 

SDNN HRV chart

Heart attack patients with SDNN values over 100 ms have been reported to have a 5.3 lower mortality risk than those with under 50 ms. A higher number usually indicates that your body is coping better with stress.

pNN50 - another notable measure of HRV

pNN50 shows how active your parasympathetic system is relative to the sympathetic nervous system. The higher the value, the more relaxed the body is. If the pNN50 is low, you’re either tired or over-stressed.

This method is derived from a 1984 study, which introduced the NN50 count. It is defined as the mean number of times an hour in which the change in successive NN intervals exceeds 50 ms. It is believed that this measure helps assess parasympathetic activity from 24-hour ECG recordings, and the study presented supporting data by comparing pNN50 values in healthy subjects with those with diabetes mellitus and patients who’ve had a heart transplant.

pNN50 HRV chart

What we use at Welltory

At Welltory, our goal is to assess how the working of your nervous and immune systems contribute to making everything run smoothly. To do this, we pick specific metrics to see how we can use them to evaluate different “regulation branches” separately. For example, we look at both the short-term NN interval variability and the long-term NN interval variability metrics, as well as some correlation rhythmography parameters and the main statistical metrics.

To understand what to rely on in our calculations, we have analyzed normal ranges and metrics for evaluating heart rate variability from various scientific sources.

In addition to the HRV measurements we’ve already talked about, we also look at the following:

  • MxDMn (Difference between maximum and minimum value) — the difference between max and min RR-interval values. The higher it is, the more active your parasympathetic nervous system is, and the better your body recovers.
  • AMo50 (Mode amplitude) — evaluates the sympathetic activity. The higher the value, the more active the sympathetic system is.
  • Mean RR — the average time between heartbeats in milliseconds

There are also some more sophisticated parameters of frequency-domain analysis, which, for example, Welltory carries out with a 300 beat-long user measurement.
These are spectral analysis components:

  • Total Power HRV — reflects the total power of HF, LF, and VLF waves. This shows how much power the body has, and how well it’s adapting to stress. This value drops when you’re over-stressed or sick.
  • HF (High frequency) — shows the power of high-frequency waves produced by the parasympathetic nervous system. The higher this number is, the more relaxed you are.
  • LF (Low frequency) — shows the power of low-frequency waves produced by the sympathetic nervous system. The higher it is, the more mobilized your body’s systems are.
  • VLF (Very low frequency) — shows the power of very low frequency waves, which show how the heart is affected by hormones and reflexes. If it’s too high, this means the body is exhausted or sick, and the autonomic nervous system isn’t coping well with stress.
  • LF/HF — shows which system is working harder: parasympathetic or sympathetic. A value over 2 means the body’s systems are too mobilized, and a value of less than 1 means you’re relaxed. A value between 1 & 2 means your systems are balanced.
  • HF/LF/VLF (Wave balance) — shows the power of high frequency (HF) waves, low frequency (LF) waves and very low frequency (VLF) waves. This shows which system is currently regulating the heart’s activity. The higher the HF value, the more relaxed the body is. The higher the LF value, the more mobilized the body. If the VLF is more active – the body is exhausted or sick and not coping with stress.

If you’re a Welltory subscriber, you can check out all the metrics we’ve discussed and see how you score after each measurement. 

Frequently Asked Questions

Yes, many people use RMSSD HRV as a self-assessment tool to gain insights into their stress levels and overall well-being. Tracking your RMSSD scores over time can help you identify patterns and make informed decisions about your lifestyle and habits for better health.

HRV measurements significantly correlate with perceived psychological stress and can be used as a stress assessment tool. For example, Welltory’s developers designed a proprietary algorithm that assesses psychological stress levels based on heart rate variability analysis, which may or may not correlate with psychological stress depending on your personal stress tolerance. 

Yes, adopting a healthier lifestyle can positively impact your HRV. Regular exercise, stress management techniques like meditation, sufficient sleep, and a balanced diet are all factors that can contribute to improved HRV over time. With Welltory, you’ll get step-by-step guidance and daily recommendations that will help you feel better and live a healthier life.

However, we understand the curiosity about averages, and our data suggests that 19 to 48 ms is the average for healthy adults in the age group of 38 – 42 years and 35 – 107 ms for elite athletes. Thus the ‘normal’ average range for rMSSD is 19 to 107 ms which is such a broad generalization that it’s quite clear that individual differences are too pronounced to make a general statement about averages in HRV scores.

Welltory Team, updated on 25 Aug. 2023

Learn more

Eating Before Bed

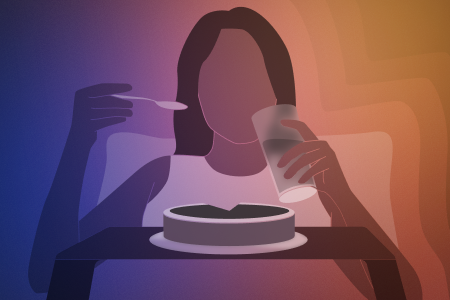
Discover the intricate relationship between late-night eating and its impact on sleep duration and quality

Blood Oxygen Levels

Blood Oxygen Levels

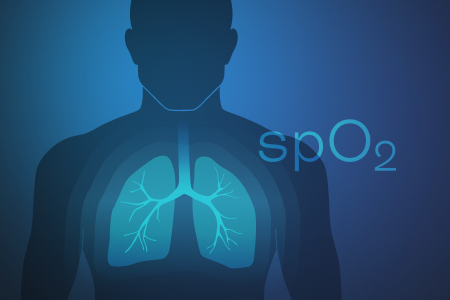
From boosting cognitive function to enhancing physical performance, discover the impact of blood oxygen levels on various aspects of health

Headaches at Night

Headaches at Night

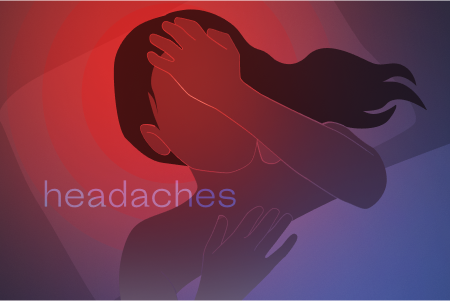
All you needed to know about headaches at night – types of nighttime headaches, their causes, possible treatment and how to avoid them.