The 12 Common Mistakes When Measuring Heart Rate Variability
Be sure that you are not making these common mistakes when measuring your heart rate variability (HRV) – so you get the most out of your HRV measurements.
Home » Heart Rate Variability » Simple explanation of Heart Rate Variability

Let’s talk about what heart rate variability is, why popular wearables like Apple Watch and Oura Ring are starting to measure it, and why Olympic athletes and astronauts have been using it for years.
One could simply explain heart rate variability as the variation in the time lapsed between your heartbeats. It’s important to note that this is not the same as heart rate. Heart rate is the average number of beats per minute — so let’s say that if your BPM is at 60, that doesn’t mean that there is a beat every second. There is plenty of variation, and it looks something like this:
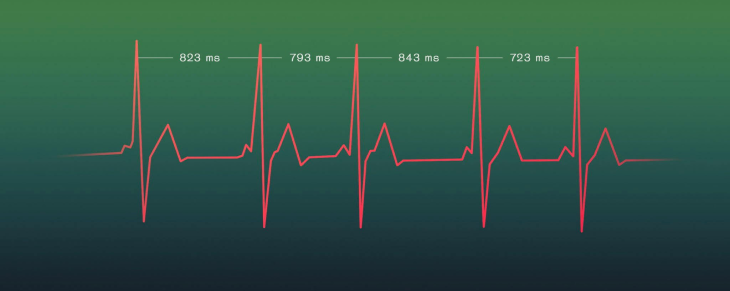
The image shows that there is 0.823 seconds between the first and the second beat, 0.793 seconds between the third and fourth, and so on. That variation is precisely what heart rate variability (HRV) is.
This “unevenness” is ordinary. Your nervous system is constantly scanning your body and adapts to certain changes in order to keep things running smoothly: blood pressure, temperature, heartbeat, and so on. So what the heart rate variability tells you is that, for instance, the higher your variability is, the more responsive your body is to changes, and the easier it adapts. The lower it is, the less responsive your body is to changes. What affects heart rate variability are several factors. For instance, low variability is typically a sign of stress, fatigue, or illness.
There is no such thing as an “ideal heart rate variability” or “the best hrv measurements”, it will vary from usually being higher in the morning to lower at night.
No, the history of heart rate variability traces back to the Ancient Greeks who were the first to notice that the heartbeat changes. The Greek physician Galen wrote 18 papers on the heart rate, analyzing it to diagnose patients and predict how well they would cope with an illness.
German physician Carl Ludwig was the first to actually measure variability in 1847. He studied heart rate in dogs, noting that it speeds up on the inhale and slows down with the exhale.
The next breakthrough was the invention of the ECG — electrocardiogram. The ECG made it easier to measure variability, but still required a ton of equipment.
Luckily, a more compact solution was in the works. In the early 1960s, Norman Holter invented a portable monitor that could track the heartbeat continuously. The device made it easier to study variability, and physicians began using it as a health marker in patient assessments.
Scientists came up with different ways to analyze variability over time: spectral and temporal analysis, mathematical models based on chaos theory, and so on, which makes it difficult to ultimately answer the question “who discovered heart rate variability” or “when was HRV discovered” – the heart rate variability history will remain complex but with some concrete milestones.
The scientific progress resulted in the European Society of Cardiology and the North American Society of Pacing and Electrophysiology publishing the first international standards for heart rate variability measurements in 1996, and the historical perspective on heart rate variability is obviously of high importance in order to understand the development.
There are plenty of benefits with heart rate variability and you’ll find that it’s used in various contexts. Heart rate variability is for instance frequently used by NASA to track astronaut cardiovascular health and stress levels. It helps scientists see how well astronauts adapt after coming back from a mission.

In professional sports, coaches and athletes — NBA players, NHL players, and Olympic athletes — use heart rate variability to track stress levels and recovery, adjusting their training loads to hit peak performance during competitions.
Variability is also used by military personnel who use it to assess combat readiness among soldiers. It’s also used by firefighters and emergency rescue workers. They use heart rate variability to measure stress, resilience, and overall psychological wellbeing — factors that have a big impact on how well a responder can cope in extreme situations.
A more general context is within medicine. Healthcare professionals analyze patient variability when treating chronic illnesses for instance: diabetes, renal failure, neurological and psychiatric conditions, sleep disorders, as well as rehabilitation from alcohol and drug addiction
You might ask yourself “why is heart rate variability important?” and “why does heart rate variability matter?” Monitoring your heart rate variability is a great way to identify whether your ANS, or autonomic nervous system, is balanced and functioning optimally. The measurements could be considered as feedback from your own body, showing you how well it’s coping.
A review in Neuroscience suggests that a higher resting HRV is related to better performance in cognitive tasks. In contrast, a lower resting HRV is associated with a lack of prefrontal control of the subcortical activity, which results in poor functioning of self-regulatory systems.
Your personal HRV measurement results will help you interpret what tasks you’re able to take on, and what should perhaps be avoided or postponed in your current state. The results will ultimately encourage you to potentially adjust or improve certain habits that affect your lifestyle, making it possible for you to turn down the pressure before it takes a toll on you.
Aside from investigating how much you’ll be able to get done today, heart rate variability can help you understand what relaxes you. Review how different types of rest affect your measurements — some people recover best by letting off steam with friends, while others need solitary walks or meditation.
Your personal HRV measurement results will help you interpret what tasks you’re able to take on, and what should perhaps be avoided or postponed in your current state. The results will ultimately encourage you to potentially adjust or improve certain habits that affect your lifestyle, making it possible for you to turn down the pressure before it takes a toll on you.
According to an analysis of heart rate variability, sleep phases, and sleep disturbances, heart rate variability serves as a great sleep assessment metric. Take measurements in the mornings and find out how well you recovered overnight. Evaluate how much sleep you need to feel your best, what time you ought to hit the hay, and explore how your measurements are affected when you don’t get enough sleep.

Many professional athletes track variability through Firstbeat and then use the results to plan their workout schedule and training loads. 26 national teams, half of all NHL teams, and over 23,000 high-performance athletes all over the world use variability to optimize their training.
Measuring heart rate variability will help you plan and optimize your workouts in the same way. For example, you can use measurements to make sure you’ve lowered your training load enough a few days before a marathon when you want your performance to peak.
It’s easy to get carried away during workouts and do your body more harm than good. A sharp drop in variability can be an important signal that you need to cool it for a while.
If you’re already injured, variability can help you track recovery. Olympic skier David Ryding, for example, used measurements while in recovery after the 2018 Winter Olympics.
Some people do better with kickboxing, others do best with swimming, and there are those who need yoga. Take measurements after different workouts, and see which ones make you feel best.
Yes. Heart rate variability analysis will help you:
The human being tends to worry too much over minor things — a headache, a random muscle spasm, an odd feeling in the chest. Taking a measurement can help reassure you that you’re alright. Of course, it’s no substitute for a visit to the doctor and if you’re concerned about something, do pay a visit.
Variability measurements can help identify heart issues at the early stages before they turn into chronic conditions. Research has shown that variability reflects the state of the cardiovascular system and can help identify problems. If your measurements show worrying signs, Welltory will alert you and suggest you see a doctor.
A meta-analysis of over 300 research papers has shown that chronic stress undermines the immune system. A compromised immune system means you get sick more often and take longer to recover. With proper stress management, this can be avoided — take care of your immune system, and you’ll stay healthy.
Welltory’s variability measurements will show you when something is off, even if you don’t have any obvious symptoms. This will help remind you to take preemptive measures and so recover more quickly or avoid a potential cold.
Variability is linked to the immune system and inflammatory processes that combat infections, and so measurements can help track the course of a cold. If your variability scores keep dropping, it may be a sign that you really need to lay off and potentially talk to your doctor.
Just like physical stress, emotional stress takes a toll on the body. Heart rate variability has been linked to emotional burnout, depression, panic attacks, PTSD, and overall levels of emotional stress. Heart rate variability is also used in stress and anxiety management programs. Heart rate variability analysis can help you:
You’ll be able to understand the physiological factors behind your feelings. For example, you may be feeling down due to low stress levels, and a quick run will put your head in the right place.
Say you’re having an irritable, snappy day, and are annoyed with yourself for it. The problem will most likely not be you — instead, high stress levels might be the cause. If that is the case, you’ll know to shift your focus to self-care instead of blaming yourself and others for how you’re feeling.
Find out what helps you most when the going gets tough: talking to a friend, getting some fresh air on a walk, or maybe meditating.
There are tons of different techniques that can help you manage your mental health. Use variability analysis to find out what works. For example, you can check what helps you destress better: visualization, progressive muscle relaxation, or deep breathing practice.

Measuring heart rate variability can help you see which aspects of your lifestyle need to change in order for you to be healthier and happier. Variability has been used to study the impact of diet changes on the body, meditation, and the benefits of taking vitamins. Lower variability has also been linked to unhealthy habits. Heart rate variability analysis can help you:
For example, say you decide to stop eating meat or try a paleo diet. Variability will help you see how your body is responding to it — maybe it’s stressing you out instead of helping.
We often think that having a cup of coffee before bed is no big deal. Or another glass of wine, a cigarette, a slice of cake. But these small things can, in fact, be very rough on the body. Measurements can show you what’s actually happening, and you’ll experience something called the observer effect — that’s when you change your habits effortlessly, simply because you’re more aware of how they impact your systems.
For example, say you started meditating, taking vitamins, or getting up a bit later. Changes in your variability can show you if it’s impacting your body in a positive way.
There are 3 ways to measure your heart rate variability. It’s not necessarily the best way to measure heart rate variability, but the quickest and most accessible option is photoplethysmography, or PPG. But let’s go over all of them:
The most complicated and equipment-heavy approach. You get a doctor’s appointment, take off your clothes, and will be covered with sensors that track electrical impulses from your heart. But measuring variability is not the main purpose of an ECG. It’s used to diagnose heart issues and is far too much work for a simple variability measurement.
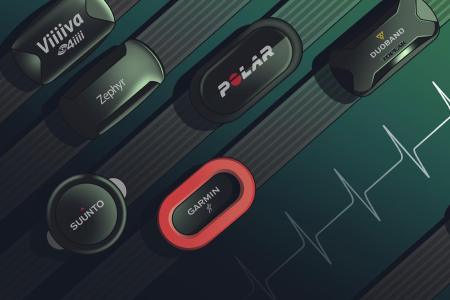
This is when a heart rate monitor is placed near the heart to read electrical signals. This approach is a bit simpler but is also not always accessible. Quality heart rate monitors tend to be expensive, plus you need to put it on every time you want to take a measurement. Carrying a heart rate monitor around everywhere isn’t convenient.
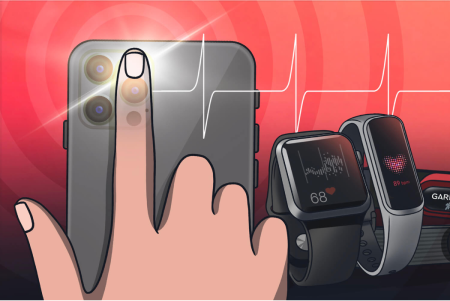
When the heart beats, it pumps out blood and increases the amount of hemoglobin in the blood vessels — a compound that absorbs light. In between beats, the amount of hemoglobin decreases. This process can be tracked with a smartphone camera and is hence a way to measure HRV at home: the flash illuminates the skin, and the camera records a video. The brightness of the frame reflects how much light that has been absorbed by hemoglobin. Welltory uses changes in the brightness of the frame to estimate how much time that lapses between each heartbeat — all you have to do is to cover your camera with your finger or use an Apple Watch, and the app will measure your variability. Both of which are simple devices to measure heart rate variability.

Sure. There are two meta-analyses that prove photoplethysmography to be effective. Measurement accuracy is on par with heart rate monitors and ECGs.
And unlike the other approaches, camera heart rate variability is much more convenient. You don’t have to see a doctor and you don’t need a ton of sensors. Just put your finger on the camera, and sit still for a couple of minutes.
Apple Watch and Oura Ring use the same technique to measure heart rate variability. Welltory adapts the measurement algorithm to different smartphones as well. Their cameras, for instance, vary in brightness of the flash. Plus, we improve accuracy by adjusting according to behavioral factors — people not sitting still, controlling their breathing, or talking, for example. Our algorithms can identify these factors and take them into account when processing measurements and could hence be considered as one of the best camera-based heart rate variability apps for android.
We have presented our photoplethysmography algorithm at the biggest biotech conference in Europe — the International Conference of the IEEE Engineering in Medicine and Biology Society. Currently, no other app in the world can take such accurate camera measurements.
Let’s go over heart rate variability monitoring and how to check your heart rate variability: All you have to do is launch the app, hit the measurement button, and put your finger on the camera. If you carry an Apple Watch, you don’t have to do anything at all — it takes measurements automatically making it a very accessible heart rate variability monitoring device.
Welltory then launches a complex time series analysis of the measurement. We estimate metrics that reflect the state of your nervous system, build histograms and perform a frequency, temporal, and spectral analysis of the measurement.

For example, there is a metric called SDNN — that’s the standard deviation of beat-to-beat intervals from the mean value. SDNN shows how well your nervous system adapts to stress.
Another important metric is pNN50 — the percent of consecutive intervals that differ by more than 50 ms. It shows how stable the body’s systems are and which processes are at work: stress or relaxation. A low pNN50 is is a sign of high stress.
One important caveat is that these metrics need to be analyzed comprehensively. When analyzed separately, they can’t give a complete picture of what’s happening with the body.
Welltory calculates 15+ heart rate variability metrics, while Apple Watch and Oura Ring give you just one — not enough for a detailed analysis. Only a comprehensive analysis can give you a complete picture of what’s happening with your body.
These metrics can also be tracked with an ECG, but it will only be able to give you raw metrics that are tough to interpret. Welltory not only takes measurements but explains what the numbers mean in simple terms.
Welltory’s algorithms are trained on 12 million measurements. Nobody else in the world has such an extensive database.
We compare your results to other people of the same height, weight, age, and gender, adjusting our interpretations accordingly.
Welltory also takes into account your personal baselines. With each new measurement, the algorithm understands your body better and gives you more accurate results. It’s like having a physician in your pocket to track and analyze your heartbeat data. For example, Welltory can use even the smallest changes in variability to determine that you’re getting sick, even before you feel any symptoms.
Welltory Team, 23 Dec. 2021

Be sure that you are not making these common mistakes when measuring your heart rate variability (HRV) – so you get the most out of your HRV measurements.

Learn everything you need to know about what are Heart Rate Zones and how to calculate your personal training heart rate zones with Welltory.
Measure heart rate variability with the best HRV Monitors Compatible With Welltory
The Ultimate HRV guide about what Heart Rate Variability is and how to implement HRV in daily life with Welltory
7 simple rules for accurate heart rate variability measurement.
Find out how heart rate variability measurements are taken with smartphone cameras and heart rate monitors.
 App Store
 Google Play
 Huawei AppGallery
 Galaxy Store


