


Blog
Ranking the Top US States for Mental Health
Mental health is a daily challenge for Americans across the country, but some states consistently fare better than others. This ranking takes a closer look at the issue and ranks all 50 states by a Mental Health Score, which is derived from factors such as stress levels, recovery rates, sleep duration, loneliness, cost of living, and unemployment.
Which States Lead the Way in Mental Health?
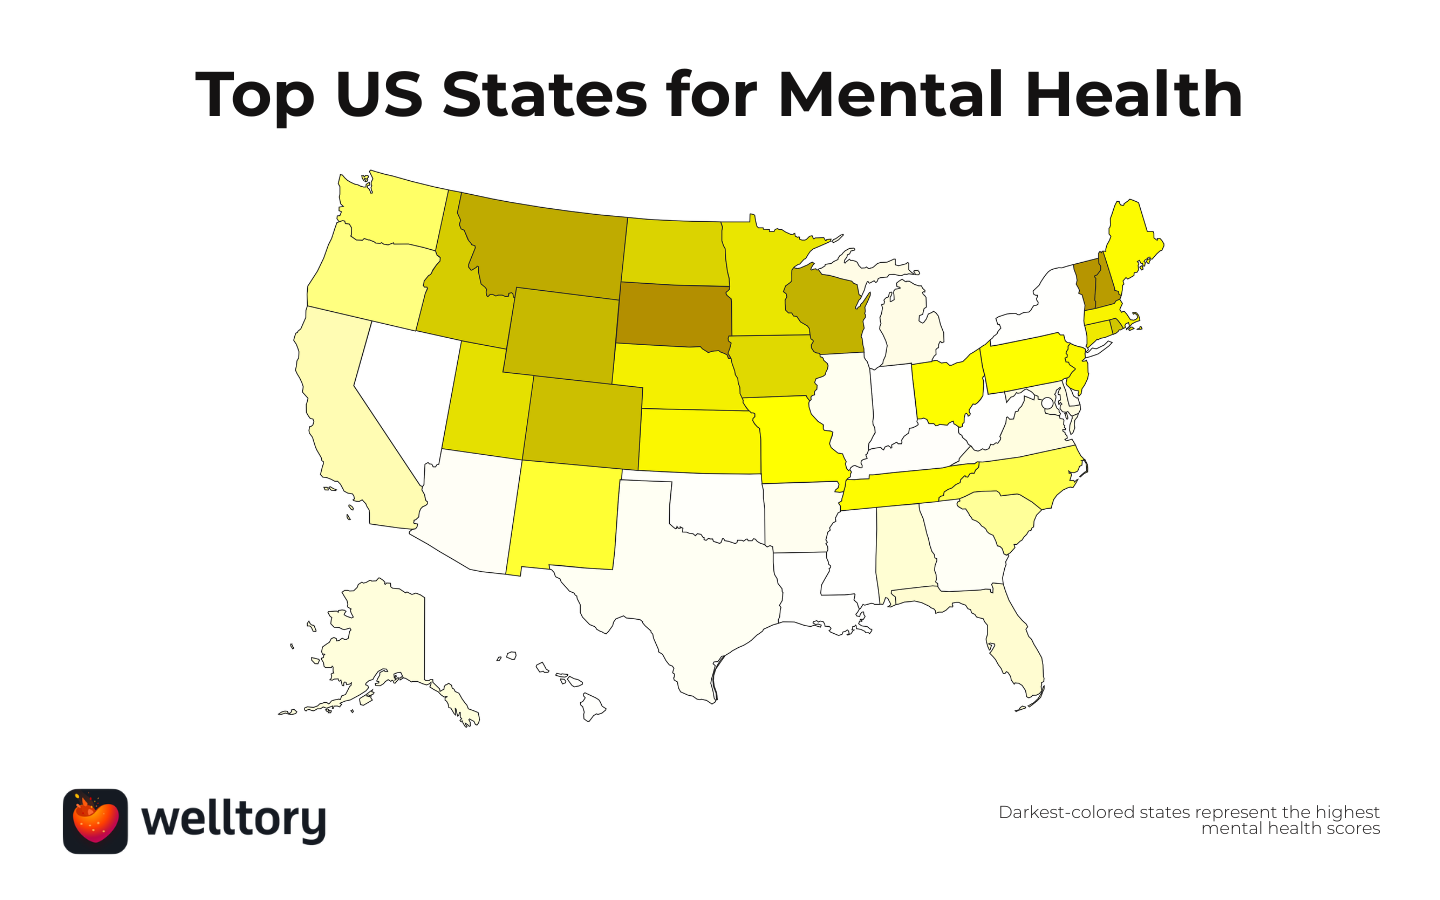
According to the ranking, South Dakota tops the list with the highest Mental Health Score, indicating that residents experience lower stress, higher recovery, and better overall wellbeing. Factors such as strong social connections and low unemployment contribute to the state’s top ranking.
Other states in the top 5 include Vermont, New Hampshire, Montana, and Wisconsin which also benefit from low stress levels, higher recovery levels, and low unemployment. On the other end of the spectrum, states like Nevada, West Virginia, and Mississippi rank lowest, with higher stress levels, shorter sleep duration, and elevated loneliness contributing to lower Mental Health Scores.
Complete Ranking List
Methodology and Sources
The State Mental Health Score was developed by analyzing all 50 U.S. states and combining six key indicators into a single score from 0 to 100. Three of these indicators, stress levels, recovery levels, and sleep duration come from anonymized, aggregated data collected from Welltory app users, providing a real-world look at daily mental wellbeing. The other three indicators, loneliness, cost of living, and unemployment come from publicly available sources and provide additional context on lifestyle and socioeconomic conditions.
- Average Stress Levels: is measured using heart rate variability (HRV) via the Welltory app from a smartphone camera or wearable. HRV reflects the body’s physiological stress response, providing an objective 0–100% stress score. Unlike surveys, it captures stress directly and is widely recognized as a valid biomarker in research, medicine, and sports science.
- Average Recovery Levels: represents the ability of users to recover from stress, reflecting resilience and mental balance.
- Sleep Duration: Average nightly sleep reported by Welltory users, which is strongly linked to mental health and cognitive function.
- Loneliness: Adults who say they feel lonely sometimes or more often.
- Cost of Living Index: A single index that combines key expenses: housing, utilities, groceries, transport, healthcare, and other essentials into one number to compare states.
- Unemployment: State-level unemployment.
Because each factor uses different units, all values were normalized using min—max normalization so that higher numbers always indicate better mental wellbeing. Negative factors (stress, loneliness, cost of living, unemployment) were reversed during normalization.
Each factor was then weighted based on its relevance to mental health: stress and recovery received the highest weight, followed by sleep and loneliness, with cost of living and unemployment contributing smaller weights. These weighted factors were combined to produce the final State Mental Health Score for each state.
Sources: Welltory, U.S. Census Bureau, Bureau of Labour Statistics, World Population Review
*Disclaimer: This analysis is based on data from 2025–2026. Stress, recovery, and sleep metrics are derived from over 1M anonymized Welltory user data, with user distribution varying by state. The results reflect the available data and methodology and are intended as a comparative overview rather than a definitive measure of mental health.


.svg)


