

Short answer
HRV by age follows a clear pattern: it is highest in young adulthood and drops with each decade. In a study of 1,906 healthy adults, typical 5-minute RMSSD fell from about 36–38 ms at ages 25–34 to about 17 ms at ages 65–74. Your own trend over time says more than any chart.
If your HRV is lower than it was ten years ago, you're not imagining it — and it's not a character flaw or a sign that you're failing at your health. A slow decline is one of the most consistent findings in heart research. It happens in healthy, active people too. What you can change is where you sit within your own range, and how quickly you bounce back after a hard week.
This article gives you a clear HRV by age chart built from primary studies, explains what "normal" and "good" really mean for your age, why HRV declines, what else pushes it down, how to raise it in midlife and later, and when a declining HRV is worth taking to a doctor.
What is HRV, and what does the number measure?
Heart rate variability is the tiny variation in time between one heartbeat and the next. Even at a steady 60 beats per minute, your heart doesn't beat exactly once a second. One gap might be 0.95 seconds, the next 1.04. That variation is healthy. It mostly reflects the "rest-and-digest" branch of your nervous system (the parasympathetic system, carried largely by the vagus nerve), which gently slows and speeds the heart with every breath.
In general, more variation at rest means your nervous system is flexible and has room to adapt. Less variation means it is working harder — because of stress, poor sleep, illness, alcohol, or simply age. For a fuller explanation of the physiology, see what HRV measures.
Two measures show up in almost every study and app:
RMSSD (root mean square of successive differences) looks at how much each beat-to-beat gap differs from the next. It mainly tracks parasympathetic activity and is the measure most wearables report. (doi.org)
SDNN (standard deviation of normal-to-normal intervals) looks at the overall spread of all the gaps in a recording. It reflects both branches of the nervous system and grows with the length of the recording.
Both are reported in milliseconds (ms). The international standards for HRV, published in 1996, stress that short recordings (a few minutes) and 24-hour recordings measure different things and shouldn't be compared with each other. (doi.org) That is the single most important thing to know before you look at any HRV by age chart.
Does HRV decrease with age?
Yes. Every large study that has looked at it finds the same direction.
In one of the classic studies, researchers in Chicago recorded 24-hour heart rhythms in 260 healthy people aged 10 to 99. HRV fell with age on all five measures they used. RMSSD dropped fastest: by the 60s it was down to about 47% of its value in people in their 20s, and then it largely leveled off. SDNN declined more gradually and reached about 60% of its 20s value by the 90s. (doi.org)
The German KORA S4 study of 1,906 carefully screened, healthy adults aged 25 to 74 found the same thing with 5-minute recordings: significant changes with age in nearly every HRV measure. Interestingly, the age-related drop stopped being significant in the last decade studied (65–74). (doi.org)
Wearable data at a far larger scale agree. In more than 8.2 million Fitbit users, all HRV measures fell with age, and the parasympathetic measures fell faster than the others. Measured between 6 and 7 a.m., high-frequency power — another marker of vagal activity — was about 82% lower in men and 81% lower in women at age 60 than at age 20. (doi.org)
And when researchers follow the same people over time, rather than comparing different age groups, the decline is still there. In the UK Whitehall II study, 3,176 men and 1,238 women aged 44 to 69 at the start had their HRV measured three times over 10 years. HRV fell in both sexes, and it fell faster in the younger participants than in the older ones. (doi.org)
So if your HRV is gently drifting down across the years, that is expected. If you notice your HRV declining sharply over days or weeks, that is a different story — we cover it below.
What is the average HRV by age? An HRV by age chart from published studies
Below are two reference tables from primary studies. They are not targets. They show how the typical value — and the spread around it — changes with age when HRV is measured in a specific, controlled way.
Table 1. Short-term HRV by age and sex (5-minute ECG, lying down, after 5–10 minutes of rest). Median values with the middle 50% of people in brackets (25th–75th percentile). Healthy adults from the KORA S4 study, Germany. (doi.org)
| Age | Women: RMSSD (ms) | Men: RMSSD (ms) | Women: SDNN (ms) | Men: SDNN (ms) |
|---|---|---|---|---|
| 25–34 | 38.4 (26.1–54.5) | 36.2 (26.2–48.5) | 44.9 (35.4–58.1) | 46.0 (36.4–58.9) |
| 35–44 | 30.5 (22.4–45.7) | 28.7 (20.9–39.0) | 40.2 (32.9–53.7) | 42.6 (32.3–53.1) |
| 45–54 | 23.7 (16.9–31.3) | 21.5 (15.7–29.6) | 35.5 (26.5–44.5) | 34.5 (26.1–44.3) |
| 55–64 | 18.9 (13.2–27.3) | 17.5 (12.5–24.8) | 29.0 (22.8–35.2) | 29.9 (22.0–39.3) |
| 65–74 | 16.9 (11.1–23.9) | 16.7 (11.8–23.4) | 26.0 (18.7–32.5) | 26.5 (20.1–35.4) |
Group sizes ranged from 62 women aged 65–74 to 330 men aged 25–34.
Keep in mind that 24-hour recordings give much higher SDNN values than 5-minute ones, because they capture day and night, sleep and activity. This is exactly why the standards warn against mixing short and long recordings. (doi.org)
Two more reference points are useful:
Pooled short-term values. A systematic review of 44 studies with 21,438 healthy adults found an average short-term RMSSD of 42 ms (range across studies 19–75 ms) and SDNN of 50 ms (range 32–93 ms). The authors found large differences between people and between labs, often driven by how the recordings were cleaned and analyzed. (doi.org)
Wearable values. In the Fitbit dataset, women aged 40–41 measured between 6 and 7 a.m. had a mean RMSSD of roughly 38 to 43 ms depending on the device model. HRV also changed strongly across the day. (doi.org)
The fine print that matters. Your number depends on the device (chest strap, watch, ring, or phone camera), how long the measurement lasts, whether you are lying, sitting or asleep, the time of day, and how the software cleans up the signal. A night-time average from a ring and a 1-minute morning reading from a phone are both valid, but they are not the same number and shouldn't be held up against the same table. If you use your phone, it helps to know how accurate camera-based HRV is.
What is a normal HRV by age?
"Normal" is a wide band, not a line. Look at the brackets in Table 1: among healthy 35- to 44-year-old women, the middle half of the group had RMSSD anywhere from about 22 to 46 ms. That means a quarter of perfectly healthy women that age were below 22 ms and a quarter were above 46 ms. The same wide spread appears in every age group and in both sexes.
A few patterns hold up across studies:
The steepest drop is between your 20s and your 50s. In both tables, RMSSD roughly halves between the late 20s or early 30s and the late 50s.
After about 60, the decline slows down or stops. In the 24-hour study, RMSSD stabilized after the sixth decade. (doi.org) In KORA S4, the change from 55–64 to 65–74 was no longer statistically significant. (doi.org) A Brazilian study of 1,743 adults aged 40 to 100 found that RMSSD reached its lowest point at ages 60–69 and was slightly higher again in older groups. (doi.org)
Higher isn't always better in older age. That late rise can partly come from irregular, erratic heart rhythms rather than a healthier nervous system. In 290 adults with an average age of 71, about 21% of hourly heart rhythm plots showed abnormal patterns that pushed many HRV numbers up — and those patterns were linked to higher mortality. (doi.org) We explain this in more depth in when a good HRV reading is not good news.
So a normal HRV for your age is any value that sits within the broad range for people like you and is stable or improving for you over time.
Why does HRV decrease with age?
There is no single switch. Several slow changes add up.
The vagal brake gets weaker. Your baroreflex is the automatic system that senses blood pressure in the large arteries and adjusts heart rate beat by beat. With age, the part of this reflex that runs through the vagus nerve becomes less sensitive, so the heart responds less to each small change. Likely reasons include stiffer arteries, more oxidative stress (wear-and-tear damage from reactive molecules), and a heart that responds less to acetylcholine, the vagus nerve's chemical signal. (doi.org)
The "fight-or-flight" side runs a little hotter. Studies measuring nerve activity and noradrenaline show that background sympathetic activity rises with age in healthy adults, including sympathetic tone to the heart. (doi.org) More sympathetic drive and less vagal input both squeeze beat-to-beat variation.
It's mostly aging itself, not disease. An obvious question is whether HRV falls simply because older people have more high blood pressure, diabetes and medications. The Whitehall II team tested exactly this. The decline over 10 years was not explained by more heart and metabolic problems or medication use, and the researchers concluded that it most likely reflects normal aging. (doi.org)
But health conditions still lower the baseline. In the same study, people with cardiometabolic conditions had lower HRV at every point, and in women these conditions were linked to a faster drop in some measures. (doi.org) In the Brazilian study, people with diabetes had the lowest values on every HRV measure. (doi.org)
In everyday terms: the recovery system gets a little less springy with each decade. It's one reason a late night, a hard workout, or a stressful week can take longer to shake off at 50 than at 30.
Do men and women differ in HRV as they age?
A little, and the gap closes with age.
A meta-analysis of 172 studies with 63,612 healthy participants found that women tend to have a slightly faster heart rate and lower SDNN than men, but more high-frequency (vagal) power. In other words, women's HRV leans more toward the rest-and-digest side. (doi.org)
The size of the difference depends on age. In the 24-hour study, women under 30 had lower HRV than men on all measures, the gap narrowed after 30, and it disappeared after 50. (doi.org) In KORA S4, sex differences disappeared in the two oldest age groups. (doi.org) In the Fitbit data, RMSSD did not differ meaningfully between men and women. (doi.org)
For women in their 40s and early 50s, perimenopause adds another layer: broken sleep and night sweats can pull HRV down on top of the age trend. If you're trying to tell the two apart, see stress or perimenopause? What HRV and sleep can show.
What our data shows: a small step down each decade, and habits that still matter
We looked at the average morning HRV score of 5,056 adult Welltory users over a 90-day window. This score is Welltory's own unitless index, so the numbers below are not milliseconds and shouldn't be compared with the tables above. What matters is the direction and the size of the gaps.
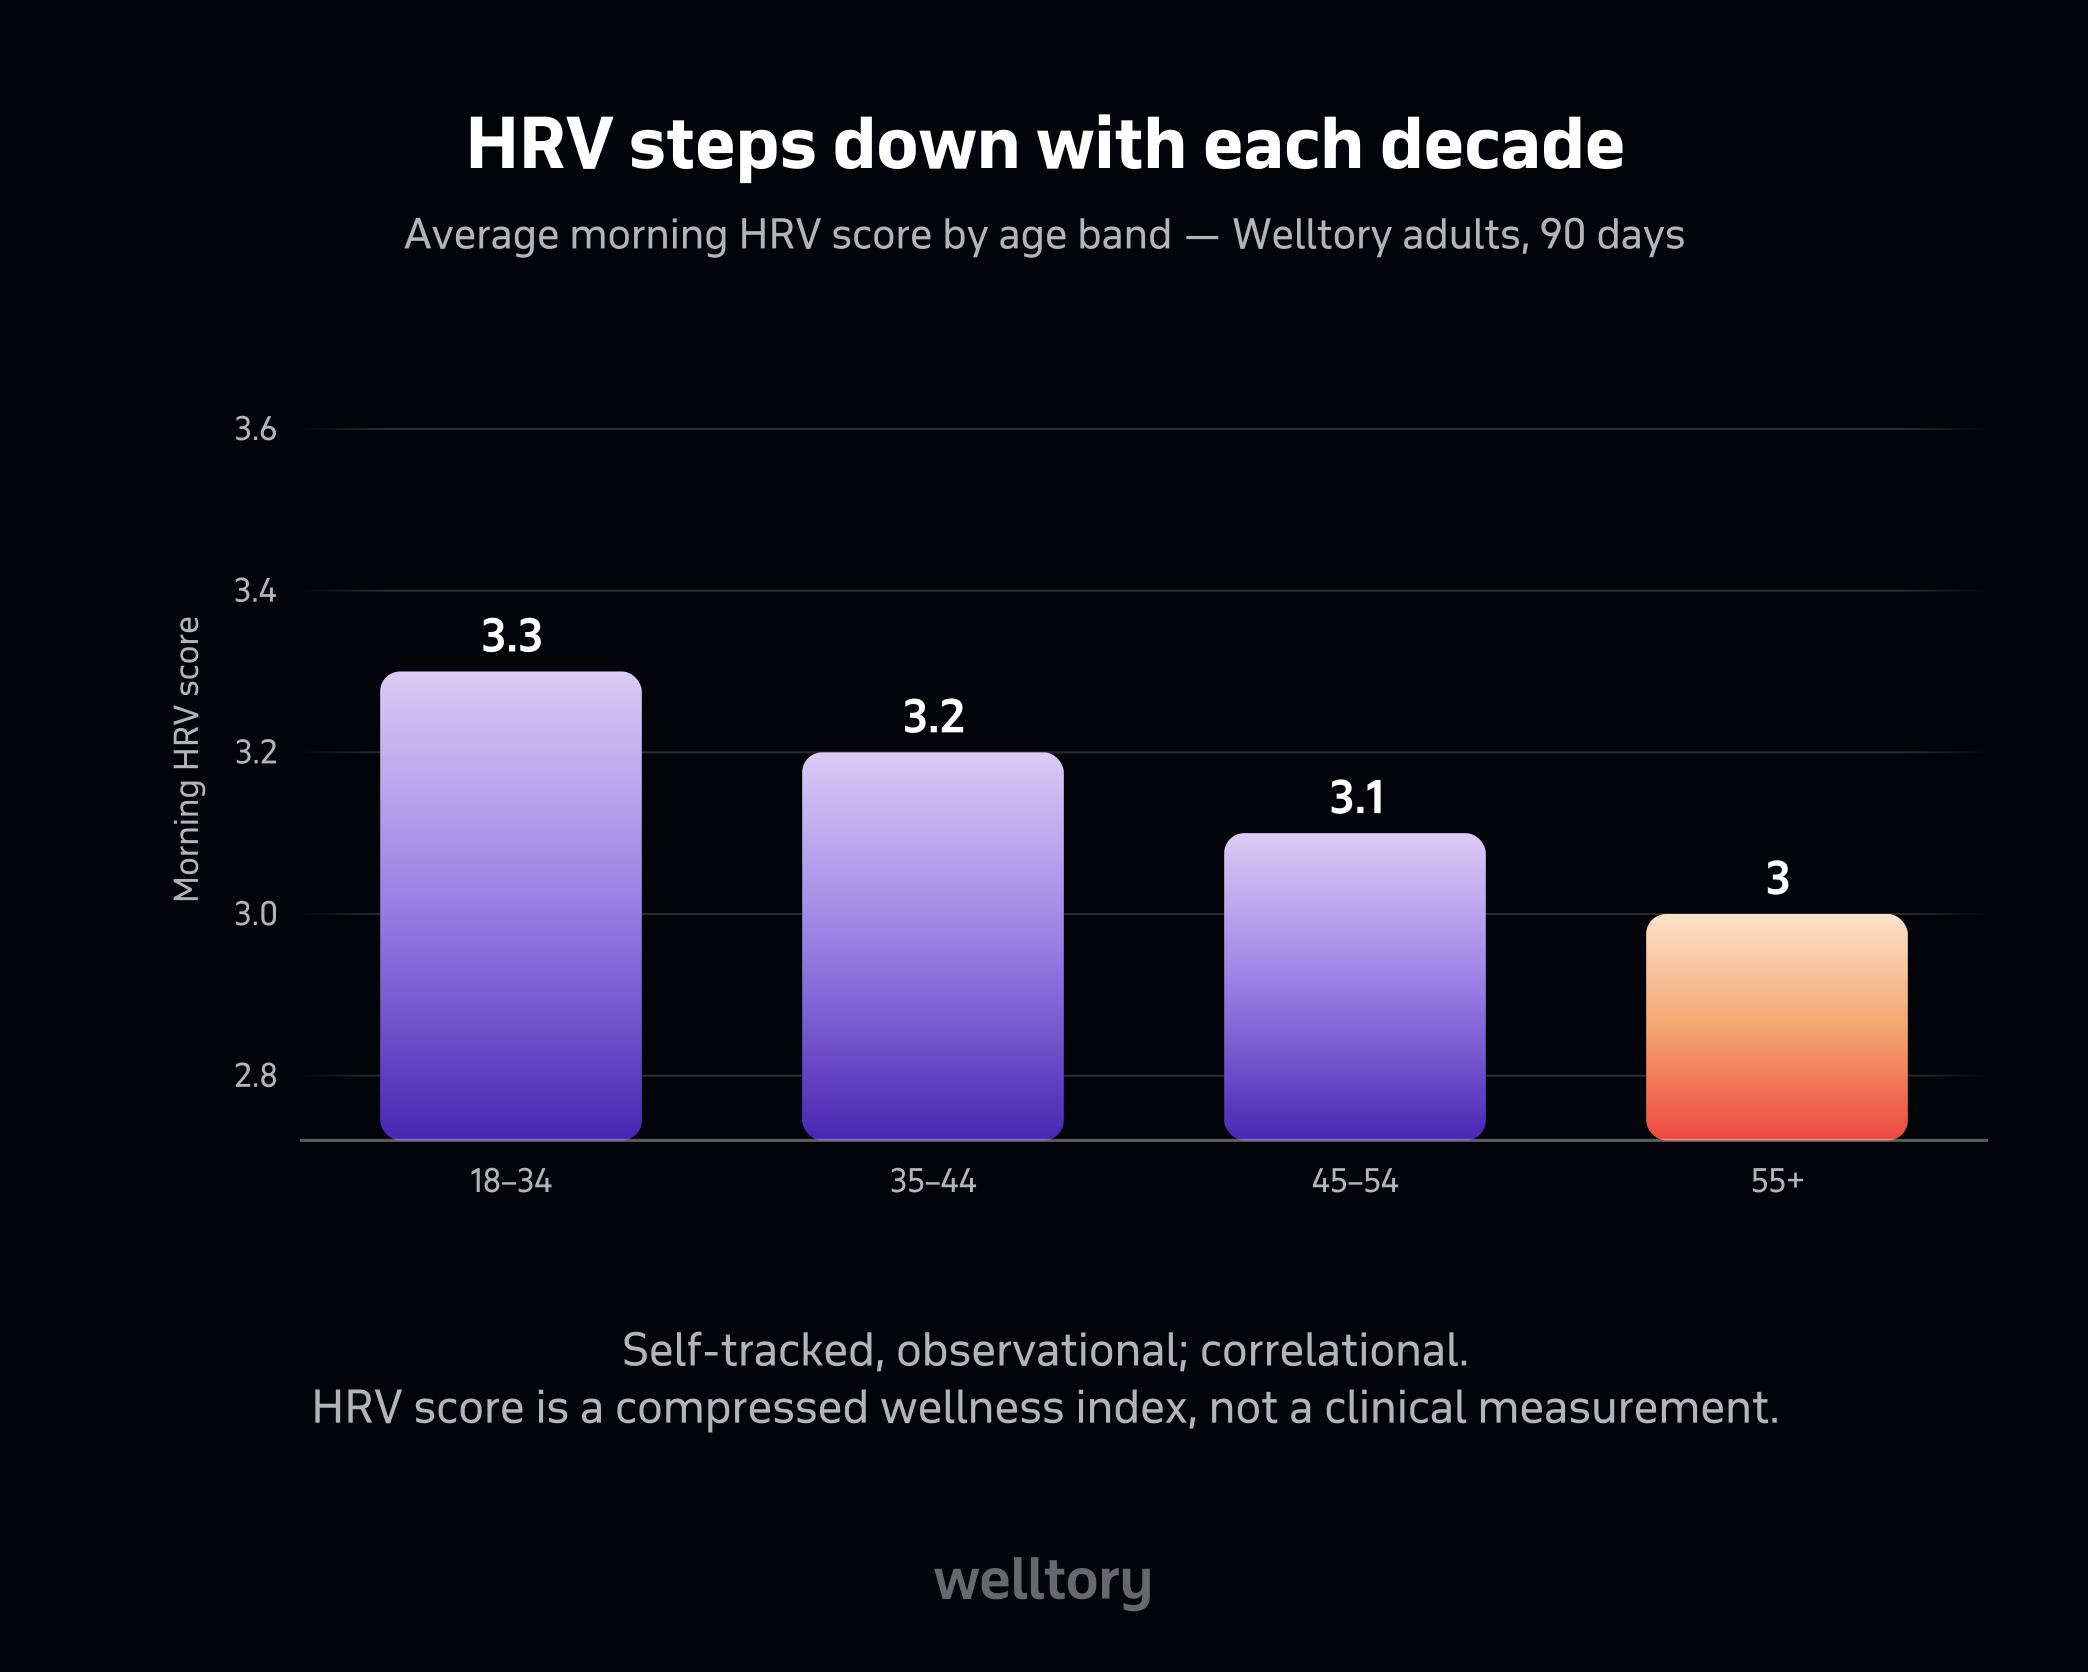
By age. The pattern mirrors the research almost exactly. Users aged 18–34 (217 people) averaged 3.3. Those aged 35–44 (762 people) averaged 3.2, those aged 45–54 (1,444 people) averaged 3.1, and those aged 55 and older (2,633 people) averaged 3.0. That is a small, steady step down with each band, not a cliff.
By sex. Men followed the same staircase: 3.3, 3.2, 3.1, then 3.0 in the oldest group. Women tracked men through the first three bands (3.3, 3.2, 3.1) and then held at 3.1 in the 55+ group. That fits the published finding that sex differences shift and shrink later in life, although our data can't tell us why.
By habits. We also compared two groups with very different lifestyles. Adults who were the most active, slept 7 or more hours, and had below-median stress (692 people) averaged a morning HRV score of 3.2. Adults who were the least active, slept less, and had high stress (232 people) averaged 3.0. That 0.2-point gap is roughly two-thirds of the entire 0.3-point difference between our youngest and oldest age bands.
In plain words: age sets a slowly drifting baseline, and daily habits seem to move you up or down from it. These groups weren't matched for age, and people with better sleep and lower stress may differ in other ways too, so this doesn't prove that habits raise HRV. But it lines up with the exercise trials described below.
What is a good HRV for my age?
The honest answer: a good HRV is one that is stable or improving for you, measured the same way each time. Comparing yourself with a stranger's number — or with an influencer's screenshot — tells you very little, because healthy people of the same age can differ by a factor of two or more.
Population numbers still have a use. They show what's typical, and at a group level, higher HRV is linked to better outcomes. In a meta-analysis of eight studies with 21,988 people without known heart disease, those with the lowest HRV had a 32–45% higher risk of a first cardiovascular event than those with the highest. (doi.org) In the Framingham Heart Study, lower HRV in 736 older adults (average age 72) was linked to higher all-cause mortality over four years. (doi.org) These are statistical links across large groups. They don't mean that a single low reading on your watch predicts anything about you.
A practical way to think about "good for my age":
Know your personal range. After two to four weeks of consistent measurements, you'll see your usual band.
Place it loosely against your age group. If you measure in a similar way to a study (for example, a short resting reading), Table 1 gives a rough sense of whether you're in the lower, middle, or upper part of the range. Don't read too much into it.
Watch the direction. A value in the lower part of the range that has been stable for years is less concerning than a value that has dropped by a third in a month.
If you're curious how your resting heart rate fits into the same picture, see what a normal resting heart rate is.
How to read your own HRV trend without spiraling
HRV is noisy. It moves with sleep, meals, alcohol, training, menstrual cycle, travel, illness, and even how you breathe during the measurement. That is normal, and it's why single readings mislead. We explain the day-to-day swings in why HRV fluctuates day to day.
A few habits make your trend far more trustworthy:
Measure the same way every time. Same time of day (first thing in the morning is easiest), same position, before coffee and before checking email. If you track during sleep, compare nights with nights. Night-time HRV behaves differently from daytime values — see HRV during sleep.
Look at weekly averages, not days. A 7-day rolling average smooths out the noise. A single low morning after a late dinner or a glass of wine means very little.
Think in weeks and months for age effects. The age-related drop is slow — several milliseconds per decade in the tables above. You won't see aging in a month. If you see a big change in a month, something else is going on.
Tag what's happening. Notes on sleep, alcohol, workouts, illness, and stressful events turn a wiggly line into a story you can act on.
Use the tool you'll stick with. Consistency beats precision. If you don't want a wearable, you can still measure HRV without one.
Read this way, HRV works like a dashboard. It often dips before you consciously feel run down, and it tends to rise as better sleep, training, and recovery take hold. That feedback is the real value of tracking it at any age.
What lowers HRV besides age?
Age explains the slow drift. These are the things that most often cause sharper drops, and most of them are reversible.
Short or broken sleep. In a lab study, 18 healthy young adults stayed awake for 36 hours. Their parasympathetic activity fell, sympathetic activity rose, and baroreflex sensitivity dropped. (doi.org) The sample was small and young, but the direction fits what most people see in their own data after a bad night.
Alcohol. In a real-world study of 4,098 Finnish employees (average age 45), drinking was followed by lower HRV and poorer recovery during the first three hours of sleep, in a dose-dependent way. An HRV-based recovery score fell by an average of 9.3, 24.0, and 39.2 percentage points after low, moderate, and high intake. Being physically active didn't protect people from the effect. (doi.org) More on this in what alcohol does to next-day HRV, heart rate and sleep.
Psychological stress. A review of 37 studies found that stress most often showed up as lower parasympathetic activity — a drop in high-frequency HRV. (doi.org)
Illness and infection. In a study of health care workers wearing Apple Watches, changes in the daily rhythm of HRV (SDNN) appeared in the seven days before a COVID-19 diagnosis, and again on the first day of symptoms. (doi.org) Many people notice a similar dip before a cold.
Depression. In a meta-analysis of 673 people with depression and 407 healthy controls, depression was linked to lower HRV, and more severe depression went with lower HRV. (doi.org)
Cardiometabolic conditions. Diabetes, in particular, is linked to lower HRV on every measure. (doi.org)
Medications — in both directions. In the same depression meta-analysis, tricyclic antidepressants lowered HRV, while SSRIs, mirtazapine, and nefazodone had no significant effect. (doi.org) Beta-blockers, on the other hand, can raise HRV: in 20 patients recovering from a heart attack, atenolol or metoprolol slowed the heart and increased overall RR variability and the vagal component of HRV. (doi.org) In Whitehall II, people taking medications other than beta-blockers had lower HRV. (doi.org) If you start, stop, or change the dose of a heart or mood medication, expect your HRV baseline to shift — and don't mistake a beta-blocker bump for a fitness gain.
How can you improve HRV as you age?
You can't turn a 60-year-old's HRV into a 25-year-old's. But the evidence says you can move up within your age range, and the older you are, the more there may be to gain.
Aerobic exercise has the best evidence. In a classic trial, 13 healthy men aged 60 to 82 and 11 men aged 24 to 32 did six months of aerobic training. Before training, the older men's HRV was 47% lower than the younger men's. After training, it rose by 68% in the older men (from 31 to 52 ms) and by 17% in the younger men. (doi.org) The sample was small and all male, but the size of the change is striking.
Systematic reviews back this up. Across 13 studies in healthy adults aged 60 and over, endurance, coordination, and multimodal programs improved resting HRV, while resistance training alone did not. (doi.org) A matching review of adults aged 45 to 60 found improvements after endurance and multimodal training, but not after resistance training alone. (doi.org) An earlier meta-analysis of 13 training studies found a moderate increase in vagal HRV overall, with a trend toward smaller responses in older people. (doi.org) Strength training is still valuable for muscles, bones, and blood sugar — it just doesn't seem to move HRV much on its own.
Everyday walking counts. In the Cardiovascular Health Study, 985 older adults were followed for five years with 24-hour heart recordings. More leisure-time activity, longer walking distance, and a brisker walking pace were each linked to more favorable HRV. (doi.org) In the Fitbit data, more daily steps went with higher HRV in a dose-dependent way across all ages. (doi.org) To be fair, not every study agrees: in Whitehall II, habitual physical activity didn't change the rate of HRV decline over 10 years. (doi.org) The most consistent evidence is for structured aerobic training rather than general activity levels.
Slow breathing. A meta-analysis of 223 studies found that breathing slowly — usually around six breaths a minute — raised vagal HRV during the session, right after it, and after programs lasting several sessions. (doi.org) It's free, low-risk, and takes five minutes.
Protect your sleep and go easy on alcohol. Given how strongly sleep loss and drinking pull HRV down, these are often the fastest wins. (doi.org) (doi.org)
Look after blood sugar, blood pressure, and weight. Because diabetes and other cardiometabolic problems go with lower HRV, managing them helps protect your baseline. (doi.org)
For a practical, step-by-step plan, see how to improve HRV. A realistic goal isn't to beat your younger self. It's to be the most recovered version of your current self — and to see the proof in your own trend.
When is a declining HRV worth seeing a doctor?
A slow drift over years is expected. A drop over days or weeks usually has an everyday cause — a cold, a hard training block, a stressful stretch, more wine than usual — and bounces back once that passes.
It's worth talking to a doctor if:
your HRV has stayed clearly below your usual range for two weeks or more and you can't link it to sleep, alcohol, illness, training, or stress;
the drop comes with new symptoms: unusual tiredness, breathlessness on exertion, dizziness, swollen ankles, or palpitations;
your resting heart rate has also crept up and stayed up without an obvious reason;
your HRV suddenly jumps much higher and looks erratic, especially if you're over 60 or your watch flags an irregular rhythm — unusually high, chaotic readings can reflect extra or irregular beats rather than better health (doi.org);
you've started, stopped, or changed a medication and your numbers changed sharply;
low HRV comes with low mood, loss of interest, or hopelessness that lasts more than two weeks. If you have thoughts of harming yourself, contact a crisis line or emergency services right away.
Go to emergency care straight away for chest pain or pressure, fainting, severe shortness of breath, or a very fast or irregular heartbeat that doesn't settle with rest. Don't wait for your HRV to tell you what to do.
How to bring this up with your doctor — and what to ask for
Say it plainly. "My HRV has been about 30% below my usual level for three weeks, and I've been more tired than usual" is a clear, useful opening. Lead with the symptoms. The HRV number is supporting evidence, not the headline.
Bring context. Say which device you use and how you measure (morning reading, overnight average, chest strap or phone). Show your trend over several months rather than a single day, and note any changes around the time it dropped: new medications, illness, sleep problems, alcohol, a stressful event, or a change in training.
Ask these specifically. Could any of my medications be affecting my heart rate or HRV? Is it worth checking my heart rhythm with an ECG or a longer monitor? Should we check blood pressure, blood sugar, thyroid function, or a blood count for anemia? Is my resting heart rate normal for me?
If you are dismissed. Some doctors are skeptical of wearable data, and that's partly fair — consumer HRV isn't a diagnostic test. You can say: "I understand HRV isn't diagnostic, but this is a clear change from my own baseline, and I have symptoms. Can we rule out common causes and note it in my record?" A documented concern is far more likely to be followed up.
How Welltory helps
Welltory is built around the idea at the heart of this article: compare yourself with yourself. It measures your HRV each morning — with a wearable or with your phone's camera — and tracks it alongside your resting heart rate, sleep, activity, stress load across the day, and a morning energy score that reflects how recovered you are. Each is shown against your own baseline, so you see what's normal for you rather than for an average 45-year-old.
That makes the slow age trend and the fast everyday dips easy to tell apart. You can see whether a flat week lines up with short nights, a run of evening drinks, a heavy training block, or the start of a cold — and whether your HRV climbs back as you recover. With My Patterns, you can add notes such as "wine", "long run", "new medication", or "poor sleep" and, over a few weeks, see which habits tend to come before your best and worst mornings. Guided slow-breathing sessions let you watch your body respond in real time.
What Welltory can't do: it doesn't diagnose heart disease, arrhythmias, or any other condition, and its HRV score isn't a replacement for an ECG. What it can give you is a clear, personal timeline to act on — and to share with your doctor if something changes.
How we made it
The reference values and research come from primary studies and standards: the ESC/NASPE Task Force HRV standards (Task Force 1996), an overview of HRV metrics (Shaffer & Ginsberg 2017), population and normative studies of HRV by age and sex (Umetani et al. 1998; Voss et al. 2015; Nunan et al. 2010; Almeida-Santos et al. 2016; Natarajan et al. 2020), a 10-year longitudinal cohort (Jandackova et al. 2016), a sex-differences meta-analysis (Koenig & Thayer 2016), mechanisms of autonomic aging (Monahan 2007; Seals & Esler 2000), abnormal HRV patterns in older adults (Stein et al. 2005), HRV and cardiovascular risk (Tsuji et al. 1994; Hillebrand et al. 2013), factors that lower HRV (Zhong et al. 2005; Pietilä et al. 2018; Kim et al. 2018; Hirten et al. 2021; Kemp et al. 2010; Sandrone et al. 1994), and exercise and breathing interventions (Levy et al. 1998; Sandercock et al. 2005; Soares-Miranda et al. 2014; Grässler et al. 2021a, 2021b; Laborde et al. 2022). Every DOI was checked against Crossref, and numbers were taken from the papers' abstracts, tables, or supplementary data.
The Welltory figures come from an aggregated, de-identified dataset of 5,056 adult users over a 90-day window: the average morning HRV score (a unitless Welltory index, not milliseconds) by age band (18–34, 35–44, 45–54, 55+), by sex, and for two lifestyle groups — the most active users who slept 7 or more hours with below-median stress (692) and the least active, short-sleeping, high-stress users (232). The data are observational and weren't adjusted for age or other differences between groups.


Discounts for blog readers: up to 36% off
See what affects your energy, stress, sleep, and daily state with Welltory
This article is for educational purposes only and is not medical advice. HRV is a general wellness signal, not a diagnosis; a sudden, sustained change or symptoms deserve a doctor's attention. Welltory measures physiological signals like heart rate, HRV, sleep, activity, and stress.
Was this helpful?
Ask AI for a summary of page


Written by Jane Smorodnikova

The founder and CEO of Welltory. A recognized tech leader with two Master's degrees and experience at MIT, she has scaled Welltory to over 17 million users.
Written by Tatsiana Yashyna

Deputy COO at Welltory. With a background in medicine and years of working with health data, she translates research and real physiological signals — sleep, stress, heart rate, and hormones — into clear, evidence-based explanations that help people understand what their bodies are telling them.
Reviewed by Anna Elitzur
-2.jpg)
With her medical degree, Anna reviews Welltory's health content for medical accuracy and alignment with current clinical guidelines and research.
References
- Umetani K, Singer DH, McCraty R, Atkinson M. Twenty-four hour time domain heart rate variability and heart rate: relations to age and gender over nine decades. Journal of the American College of Cardiology 1998;31(3):593-601. https://doi.org/10.1016/S0735-1097%2897%2900554-8
- Voss A, Schroeder R, Heitmann A, Peters A, Perz S. Short-term heart rate variability — influence of gender and age in healthy subjects. PLOS ONE 2015;10(3):e0118308. https://doi.org/10.1371/journal.pone.0118308
- Nunan D, Sandercock GR, Brodie DA. A quantitative systematic review of normal values for short-term heart rate variability in healthy adults. Pacing and Clinical Electrophysiology 2010;33(11):1407-1417. https://doi.org/10.1111/j.1540-8159.2010.02841.x
- Natarajan A, Pantelopoulos A, Emir-Farinas H, Natarajan P. Heart rate variability with photoplethysmography in 8 million individuals: a cross-sectional study. The Lancet Digital Health 2020;2(12):e650-e657. https://doi.org/10.1016/S2589-7500%2820%2930246-6
- Task Force of the European Society of Cardiology and the North American Society of Pacing and Electrophysiology. Heart rate variability: standards of measurement, physiological interpretation and clinical use. Circulation 1996;93(5):1043-1065. https://doi.org/10.1161/01.CIR.93.5.1043
- Shaffer F, Ginsberg JP. An overview of heart rate variability metrics and norms. Frontiers in Public Health 2017;5:258. https://doi.org/10.3389/fpubh.2017.00258
- Jandackova VK, Scholes S, Britton A, Steptoe A. Are changes in heart rate variability in middle-aged and older people normative or caused by pathological conditions? Findings from a large population-based longitudinal cohort study. Journal of the American Heart Association 2016;5(2):e002365. https://doi.org/10.1161/JAHA.115.002365
- Almeida-Santos MA, Barreto-Filho JA, Oliveira JL, Reis FP, da Cunha Oliveira CC, Sousa AC. Aging, heart rate variability and patterns of autonomic regulation of the heart. Archives of Gerontology and Geriatrics 2016;63:1-8. https://doi.org/10.1016/j.archger.2015.11.011
- Stein PK, Domitrovich PP, Hui N, Rautaharju P, Gottdiener J. Sometimes higher heart rate variability is not better heart rate variability: results of graphical and nonlinear analyses. Journal of Cardiovascular Electrophysiology 2005;16(9):954-959. https://doi.org/10.1111/j.1540-8167.2005.40788.x
- Monahan KD. Effect of aging on baroreflex function in humans. American Journal of Physiology — Regulatory, Integrative and Comparative Physiology 2007;293(1):R3-R12. https://doi.org/10.1152/ajpregu.00031.2007
- Seals DR, Esler MD. Human ageing and the sympathoadrenal system. The Journal of Physiology 2000;528(3):407-417. https://doi.org/10.1111/j.1469-7793.2000.00407.x
- Koenig J, Thayer JF. Sex differences in healthy human heart rate variability: a meta-analysis. Neuroscience & Biobehavioral Reviews 2016;64:288-310. https://doi.org/10.1016/j.neubiorev.2016.03.007
- Hillebrand S, Gast KB, de Mutsert R, et al. Heart rate variability and first cardiovascular event in populations without known cardiovascular disease: meta-analysis and dose-response meta-regression. Europace 2013;15(5):742-749. https://doi.org/10.1093/europace/eus341
- Tsuji H, Venditti FJ Jr, Manders ES, et al. Reduced heart rate variability and mortality risk in an elderly cohort: the Framingham Heart Study. Circulation 1994;90(2):878-883. https://doi.org/10.1161/01.cir.90.2.878
- Zhong X, Hilton HJ, Gates GJ, et al. Increased sympathetic and decreased parasympathetic cardiovascular modulation in normal humans with acute sleep deprivation. Journal of Applied Physiology 2005;98(6):2024-2032. https://doi.org/10.1152/japplphysiol.00620.2004
- Pietilä J, Helander E, Korhonen I, Myllymäki T, Kujala UM, Lindholm H. Acute effect of alcohol intake on cardiovascular autonomic regulation during the first hours of sleep in a large real-world sample of Finnish employees: observational study. JMIR Mental Health 2018;5(1):e23. https://doi.org/10.2196/mental.9519
- Kim HG, Cheon EJ, Bai DS, Lee YH, Koo BH. Stress and heart rate variability: a meta-analysis and review of the literature. Psychiatry Investigation 2018;15(3):235-245. https://doi.org/10.30773/pi.2017.08.17
- Hirten RP, Danieletto M, Tomalin L, et al. Use of physiological data from a wearable device to identify SARS-CoV-2 infection and symptoms and predict COVID-19 diagnosis: observational study. Journal of Medical Internet Research 2021;23(2):e26107. https://doi.org/10.2196/26107
- Kemp AH, Quintana DS, Gray MA, Felmingham KL, Brown K, Gatt JM. Impact of depression and antidepressant treatment on heart rate variability: a review and meta-analysis. Biological Psychiatry 2010;67(11):1067-1074. https://doi.org/10.1016/j.biopsych.2009.12.012
- Sandrone G, Mortara A, Torzillo D, La Rovere MT, Malliani A, Lombardi F. Effects of beta blockers (atenolol or metoprolol) on heart rate variability after acute myocardial infarction. The American Journal of Cardiology 1994;74(4):340-345. https://doi.org/10.1016/0002-9149%2894%2990400-6
- Levy WC, Cerqueira MD, Harp GD, et al. Effect of endurance exercise training on heart rate variability at rest in healthy young and older men. The American Journal of Cardiology 1998;82(10):1236-1241. https://doi.org/10.1016/S0002-9149%2898%2900611-0
- Grässler B, Thielmann B, Böckelmann I, Hökelmann A. Effects of different exercise interventions on heart rate variability and cardiovascular health factors in older adults: a systematic review. European Review of Aging and Physical Activity 2021;18(1):24. https://doi.org/10.1186/s11556-021-00278-6
- Grässler B, Thielmann B, Böckelmann I, Hökelmann A. Effects of different exercise interventions on cardiac autonomic control and secondary health factors in middle-aged adults: a systematic review. Journal of Cardiovascular Development and Disease 2021;8(8):94. https://doi.org/10.3390/jcdd8080094
- Sandercock GR, Bromley PD, Brodie DA. Effects of exercise on heart rate variability: inferences from meta-analysis. Medicine & Science in Sports & Exercise 2005;37(3):433-439. https://doi.org/10.1249/01.mss.0000155388.39002.9d
- Soares-Miranda L, Sattelmair J, Chaves P, et al. Physical activity and heart rate variability in older adults: the Cardiovascular Health Study. Circulation 2014;129(21):2100-2110. https://doi.org/10.1161/CIRCULATIONAHA.113.005361
- Laborde S, Allen MS, Borges U, et al. Effects of voluntary slow breathing on heart rate and heart rate variability: a systematic review and a meta-analysis. Neuroscience & Biobehavioral Reviews 2022;138:104711. https://doi.org/10.1016/j.neubiorev.2022.104711
- Welltory adult cohort (morning HRV score by age band, sex and lifestyle bundle, 5,056 users, 90 days). Reproducible script: `persona_lab/scripts/midlife_age_bands.py`.

