


This article is part of Nervous System Snapshot of America — 2025, a series built from readings collected passively through Welltory's Nervous System Snapshot feature. The other pieces in the series are linked at the end.
A pulse carries more than a rhythm
There is a particular kind of magic in a pulse. Press two fingers to a wrist, or let a watch do it for you, and you are eavesdropping on one of the oldest rhythms in the animal kingdom — a muscle that has been contracting, without pause, since somewhere in the first weeks of your existence as an embryo, no bigger than a lentil. We tend to think of the heartbeat as something private, something that belongs entirely to the body it lives in. Our own data suggests something stranger: that a heartbeat also carries a trace of the world outside the skin. Not just how a person feels, but where they live, and what that place asks of them.
We work at Welltory, a company that makes a health app most people use to fuss over their sleep or their stress levels. One of our core features, Nervous System Snapshot, has turned this into one of the largest passively collected reservoirs of human heart rhythm on the planet. For this study, we pulled 19.1 million heart-rate readings — captured mostly by Apple Watches worn by 18,734 opted-in users across the United States — and asked an old epidemiological question in a new key: does resting heart rate still carry a socioeconomic signature when nobody has designed the measurement, when no clinician has strapped on a cuff, when no researcher has asked a single question of the people wearing the sensors?
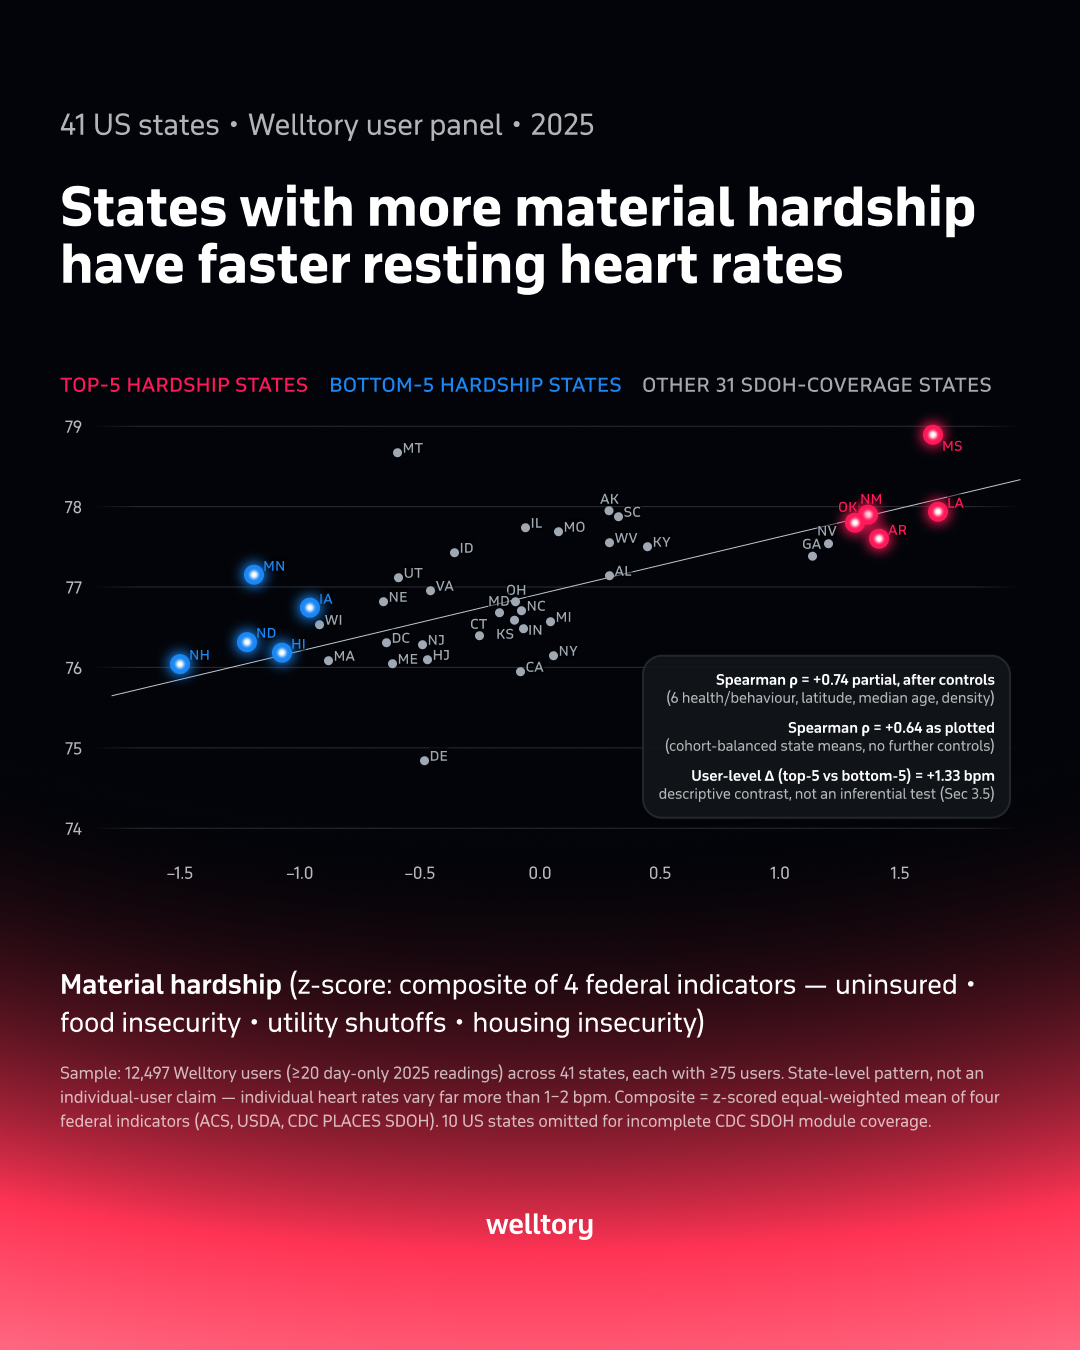
The answer, framed in the dry language of our preprint, is a partial Spearman correlation of +0.74. Framed in plainer terms, it is this: in American states where people go without health insurance, skip meals, have their electricity cut off, or struggle to keep a roof overhead, hearts beat measurably faster at rest in our panel — even after accounting for how healthy, old, dense, or northerly a state's population is. This is not a new discovery in the sense that clinicians didn't already suspect it. It is new in the sense that nobody had shown it could be picked up incidentally, by a wristwatch, from a population that never once filled out a survey about its own hardship.
An old idea, in a new instrument
The idea that stress leaves fingerprints on the cardiovascular system is not exotic. It has a name — allostatic load — coined by the neuroscientist Bruce McEwen to describe the wear a body accumulates from having its stress-response systems switched on too often, for too long. A body under chronic strain keeps its sympathetic nervous system a little more engaged than it should be, its parasympathetic brakes a little looser, and one of the most visible symptoms of that imbalance is a resting heart rate that refuses to settle as low as it might. In the French RECORD cohort, people living with the most combined personal and neighbourhood disadvantage carried resting heart rates some 3.6 beats per minute higher than the least disadvantaged — a gap wide enough, over a lifetime, to matter for cardiovascular risk.
What has been missing is not the theory but the instrument: a way to see this gradient play out across a whole country without asking a single person to describe their own circumstances, and without waiting for the next round of a national health survey to catch up. That is the gap we set out to fill, by treating a smartwatch as an unlikely piece of social science equipment.
Here is roughly how we did it. Each Apple Watch or phone-camera reading is a fragment — sixty to a hundred and twenty seconds of pulse — captured opportunistically through someone's day, not a single clean nightly measurement. No individual reading means much; a person could be climbing stairs, arguing with a colleague, laughing at a joke. But take hundreds of these fragments per person, keep only the daytime ones, take the median, and a kind of resting signature emerges — noisy for any one reading, remarkably stable in aggregate. We built exactly this per-user estimate, adjusted it for age and sex, and then averaged it up into a single number for each of forty-one states with enough contributing users. On the other side of the ledger, we built a material-hardship composite from four federal indicators that ask nothing about feelings and everything about circumstance: the share of people uninsured, the share who are food insecure, the rate of utility shutoffs, and housing insecurity.
Line the two up, and Mississippi, New Mexico, Oklahoma, Arkansas and Louisiana — the five states carrying the heaviest hardship burden in our data — show resting heart rates almost a full 1.3 beats per minute higher, per user, than the five least burdened: Minnesota, Iowa, Wisconsin, North Dakota and New Hampshire. It is a small number if you meet it as an individual. Set against the ordinary spread of heart rates between any two people in the same state — roughly nine beats per minute — a gap of 1.3 is barely a ripple. But averaged across a state's worth of wrists, that ripple becomes a gradient we could draw a line through, and the line held.
The discipline of doubting our own result
What surprised us most, revisiting this pattern, was how much of our own time went into trying to break it rather than announce it. This is, after all, an industry-authored study about our own commercial product, and we tried to treat that fact as a discipline rather than something to defend around. We ran the analysis leaving out each state in turn, and the gradient held. We reweighted the sample to match census demographics, and it held, only mildly dampened. We tested whether the pattern was secretly about race or ethnicity rather than hardship — a question we felt obliged to ask directly — and found the opposite of what a lazy critique would predict: state Black population share correlates negatively, not positively, with resting heart rate in our panel, and adding racial composition as a control strengthened the hardship association rather than explaining it away. We checked whether the pattern was really just an artefact of which model of gadget people happened to be wearing, and it wasn't. We checked whether it showed up in two other physiological metrics from the same panel — a measure of arousal, a measure of recovery — and it didn't, which is itself informative: whatever this is, it is specific to the resting pulse, not a general property of anxious data.
We also did something we think is worth being honest about: we're telling you about the version of the analysis that failed. Before we settled on the four-part hardship composite, we had pre-registered a broader "economic precarity index" mixing unemployment and housing-cost burden with the hardship measures, and it produced a far weaker association, +0.29. Only after our data suggested that rent burden was picking up expensive housing markets as much as genuine deprivation did we narrow the lens to direct experiences of hardship — insurance, food, utilities, housing insecurity — and watch the correlation strengthen. We say plainly that this makes the headline number an exploratory finding rather than a pre-specified confirmation, and we built in the appropriate penance for it: a nested cross-validation that repeats our entire selection process inside each fold of a held-out test, which knocks the correlation down but never below +0.51, and never into negative territory.
What a ripple is not
It would be easy, and wrong, to read our own study as a way to diagnose a place, or a person, from their pulse. We have tried to be careful, almost insistent, about the limits of what an aggregate pattern can tell you about any one heart. This is an ecological correlation — a statement about how states differ from one another, not a rule for reading any individual's risk from their smartwatch. A resting heart rate a beat or two above average tells you nothing reliable about the person wearing it; hearts vary for a thousand mundane reasons having nothing to do with hardship. And our panel itself is a strange, self-selected slice of America — smartwatch owners who chose to install a health app — which almost certainly under-represents the very states carrying the highest hardship, meaning the true picture, if we could ever see it whole, may be starker than our glimpse suggests, or it may not; we don't yet know which.
The point of the ripple
None of which erases what we think the finding actually is: a demonstration that a signal epidemiologists have spent decades chasing with clipboards and clinic visits can apparently be caught, faintly but unmistakably, in the exhaust data of a consumer gadget people wear to count their steps. Resting heart rate has never been a private fact only about the heart that produces it. It has always been, in some measure, a record of what a life has asked of a body — the chronic hum of insecurity translated into a few extra beats a minute, invisible to the person feeling them, legible only once you gather enough wrists and let the pattern surface.
Wearables were built to tell us about ourselves. Our study is, for us, a reminder that, gathered at scale and read carefully, they might also be quietly telling us something about the places we live — not instead of asking people directly how hard things are, but perhaps a little faster, and a little closer to real time, than we've been able to ask before.
Maria Levchenko, Valeriia Avvakumova, and Jane Smorodnikova are the authors of the preprint behind this post. Full paper linked below.
Further reading
Levchenko, M., Avvakumova, V., & Smorodnikova, J. (2026). Passive wearable physiology tracks a state-level material-hardship gradient in resting heart rate. Preprint, arXiv:2607.25301. — our own paper, the basis of this post.
Chaix, B. et al. (2011). Why socially deprived populations have a faster resting heart rate: impact of behaviour, life course anthropometry, and biology — the RECORD cohort study. Social Science & Medicine, 73(10), 1543–1550.
McEwen, B. S. (1998). Stress, adaptation, and disease: allostasis and allostatic load. Annals of the New York Academy of Sciences, 840, 33–44.
Steptoe, A., & Marmot, M. (2002). The role of psychobiological pathways in socio-economic inequalities in cardiovascular disease risk. European Heart Journal, 23(1), 13–25.
Radin, J. M., Wineinger, N. E., Topol, E. J., & Steinhubl, S. R. (2020). Harnessing wearable device data to improve state-level real-time surveillance of influenza-like illness in the USA. The Lancet Digital Health, 2(2), e85–e93.
Allan, A. C. et al. (2024). Social support moderates the association between area deprivation index and changes in physical health among adults in the Baltimore Study of Black Aging. Ethnicity & Health, 29(7), 774–792.
Robinson, W. S. (1950). Ecological correlations and the behavior of individuals. American Sociological Review, 15(3), 351–357.
Full reference list, methods, and data/code availability: see our preprint and its Zenodo deposit (DOI: 10.5281/zenodo.21391207).
Was this helpful?
Ask AI for a summary of page


Written by Valeriia Avvakumova

AI strategist and systems builder specializing in AI personalization, RAG/LLM pipelines, agentic automation, localization, GEO, Harness Engineering, Edge AI, and zero-cost AI systems. Leads AI across product, infrastructure, content, support, and marketing.
Written by Maria Levchenko
Written by Jane Smorodnikova

The founder and CEO of Welltory. A recognized tech leader with two Master's degrees and experience at MIT, she has scaled Welltory to over 17 million users.

.webp%3F2026-05-20T11%253A33%253A55.109Z&w=1536&q=100)


