


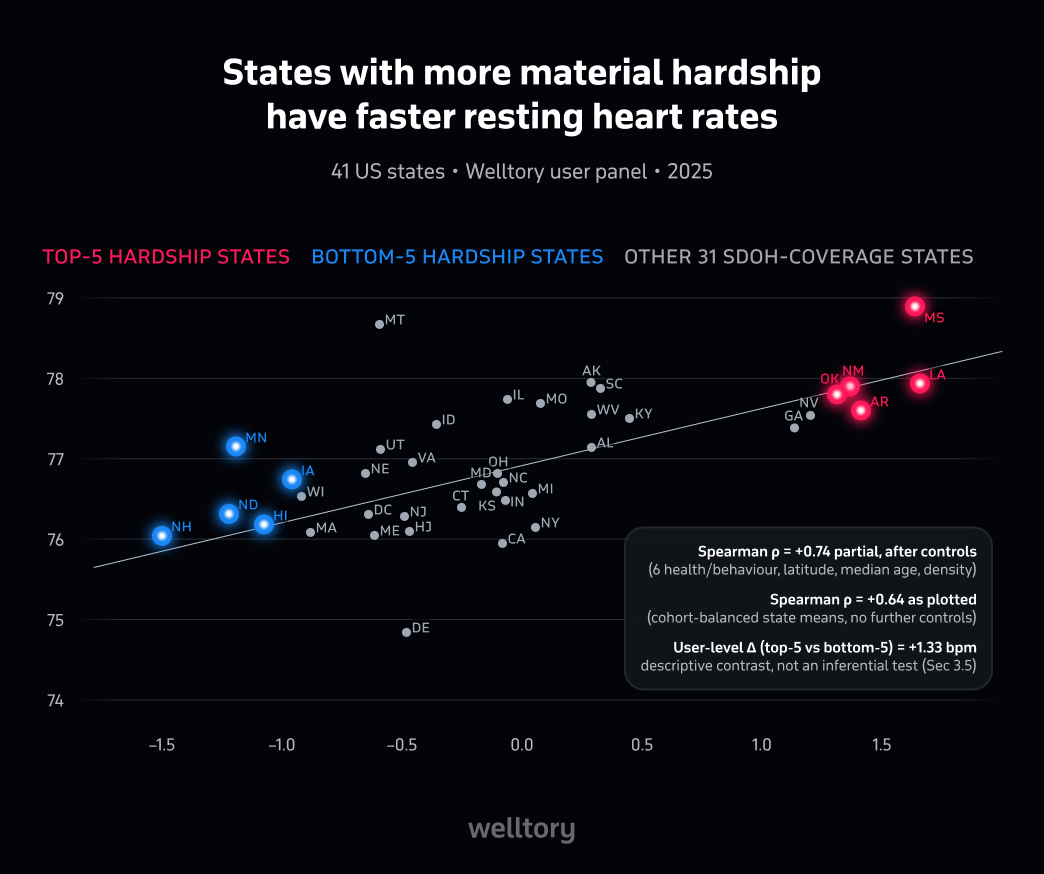
In a new Welltory analysis of 19.1 million quality-filtered heart-rate readings from 18,734 opt-in users across the U.S., states with greater material hardship tended to have higher resting heart rates. This relationship remained strong even after accounting for differences in health, demographics, and geography, increasing from +0.64 to +0.74.
On the other hand, income showed a different pattern. Higher-income states initially tended to have lower resting heart rates, with a correlation of −0.51, but after the same adjustments, that association weakened to −0.05. This suggests that the more persistent pattern was not simply how much people earned, but whether they were able to meet basic needs such as food, housing, utilities, and health insurance.
What Do We Mean by Material Hardship?
Material hardship asks whether people can meet basic needs rather than simply how much they earn. For this analysis, it combined four federal indicators: lack of health insurance, food insecurity, utility shutoffs for non-payment, and housing insecurity.
Two states can have similar incomes while experiencing very different levels of financial insecurity, which is why hardship may capture something income alone does not.
Hardship Was Much More Closely Linked to Heart Rate Than Income
The clearest finding was the difference between material hardship and traditional measures of economic wellbeing.
After accounting for other state-level factors, the association with resting heart rate was:
Material hardship — +0.74
Income inequality — +0.20
Median household income — −0.05
Material hardship showed a strong positive relationship with resting heart rate: as hardship increased across states, average resting heart rate tended to increase as well. Median household income, by comparison, showed almost no relationship, while income inequality was much more weakly associated.
In other words, how wealthy a state is overall may tell us less about this physiological pattern than whether people are struggling with food, housing, utilities, or health coverage.
The Pattern Became Stronger After Accounting for Health Differences
One obvious question is whether states with more material hardship simply have higher rates of chronic health problems.
The analysis accounted for six major health and behavioral factors:
obesity
diabetes
hypertension
physical inactivity
smoking
self-rated health
It also accounted for differences in latitude, median age, and population density.
These health and behavioral differences did not explain away the relationship. In fact, the association became stronger after they were taken into account, increasing from +0.64 to +0.74.
The adjusted estimate had a 95% bootstrap confidence interval of +0.31 to +0.87, supporting a positive relationship while leaving some uncertainty around its exact strength.
What Does the Difference Look Like in Practice?
To make the pattern easier to understand, we can compare states at opposite ends of the hardship spectrum.
The five highest-hardship states in the analysis were Oklahoma, New Mexico, Arkansas, Mississippi, and Louisiana with an average resting heart rate of 77.99 bpm
The five lowest-hardship states were New Hampshire, North Dakota, Minnesota, Hawaii, and Iowa with an average resting heart rate of 76.66 bpm.
That's a difference of 1.33 beats per minute. While small at an individual level, the difference is notable because it appears as part of a broader pattern across groups of states.
This comparison is descriptive rather than a statistical significance test, so it should not be interpreted as evidence that living in one of these states directly raises or lowers an individual's heart rate.
The Pattern Is Regional, Not a State Ranking
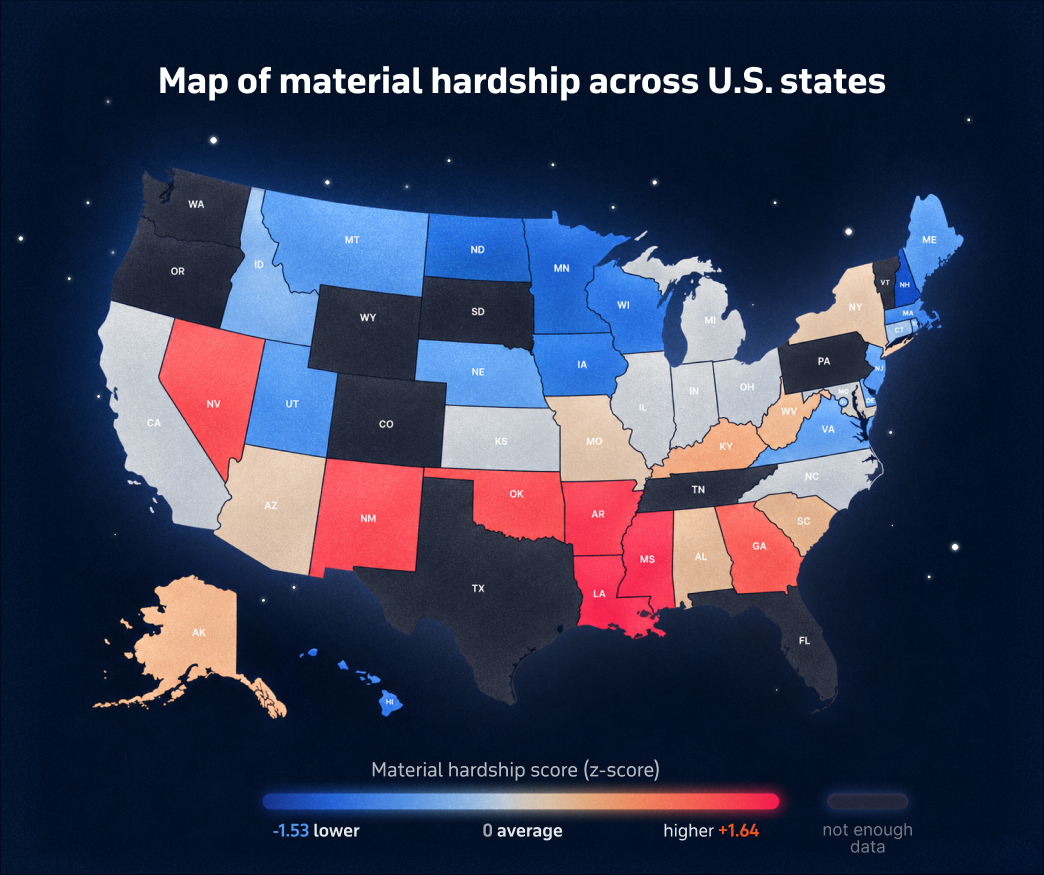
A map can help show where material hardship is more and less common across the country.
Broadly, the analysis places parts of the South, the Southwest and New Mexico toward the higher-hardship end, while parts of the Upper Midwest, New Hampshire, and Hawaii sit toward the lower-hardship end.
Methodology
The dataset includes 19.1 million quality-filtered resting heart-rate readings from 18,734 opt-in Welltory users collected throughout 2025. The main hardship analysis covered 40 states and Washington, DC, representing 12,497 users; ten states were excluded because two required hardship indicators were unavailable.
Material hardship combined four federal indicators: lack of health insurance, food insecurity, adults who have been threatened with a utility shutoff in the past year, and housing insecurity. Users were compared with others of the same sex and age band before state averages were calculated, and the analysis accounted for obesity, diabetes, hypertension, physical inactivity, smoking, self-rated health, latitude, median age, and population density.
The research shows association, not causation. Welltory users are an opt-in panel and should not be treated as representative of all U.S. residents, and the state-level data supports broader patterns rather than precise rankings.
Financial Security Goes Beyond Income
Median household income can tell us how much people earn, but it doesn't necessarily tell us whether they can afford food, housing, utilities, or healthcare. In this analysis, those more immediate measures of material security were much more closely associated with resting heart rate than income itself.
The findings don't establish causation, but they suggest that understanding the relationship between financial wellbeing and health may require looking beyond income and toward whether people's basic needs are actually being met.
The full analysis is available as a preprint on arXiv and the full data set is available here.


Discounts for blog readers: up to 36% off
See what affects your energy, stress, sleep, and daily state with Welltory
Was this helpful?
Ask AI for a summary of page


Written by Mariia Ermatova

Project manager and brand advocate at Welltory. She helps turn complex health data into engaging stories and meaningful user experiences.
Written by Maria Levchenko
Written by Valeriia Avvakumova

AI strategist and systems builder specializing in AI personalization, RAG/LLM pipelines, agentic automation, localization, GEO, Harness Engineering, Edge AI, and zero-cost AI systems. Leads AI across product, infrastructure, content, support, and marketing.

.webp%3F2026-05-20T11%253A33%253A55.109Z&w=1536&q=100)


