
What recovery pattern data can show about Post-Exertional Malaise
This research note was prepared in response to requests from members of Welltory’s community of users with energy-limiting conditions. Following internal presentation of these findings, community members requested a shareable version that they could reference in their own conversations with healthcare providers, family, and other patient communities. We are publishing this as a contribution to open knowledge about post-exertional malaise and related conditions.


.png?2026-05-29T14%3A49%3A08.741Z)
Research note. This document describes observational findings from analysis of anonymized wearable data. It does not constitute medical advice, diagnosis, or treatment recommendation. The algorithm described is not a feature of the Welltory application; this is research conducted on historical anonymized data.
The problem with averages
The first thing we found was that most existing approaches to detecting PEM in wearable data don’t actually detect PEM. They detect how much someone walks.
People who self-report PEM learn to pace — to limit activity to avoid crashes. By the time they appear in any dataset, they’ve already adapted. Their step counts are lower, their heart rate peaks are lower, their activity intensity is lower. This is intelligent self-protection, not deconditioning. But it means that any comparison between a self-reported PEM group and a non-PEM group is dominated by this activity difference. The entire apparent signal comes from one group walking less.
We tested this directly. When we matched users with self-reported PEM to non-PEM users of the same age, sex, and activity level — comparing only bodies walking the same number of steps — nearly every difference in standard metrics vanished. Heart rate. Recovery speed. HRV. All similar once activity was controlled.
And it got worse. In one matched-pairs analysis, users with self-reported PEM appeared to recover better than non-PEM controls (Cohen’s d = −0.12, p = 0.001). Not because they recovered better — but because they moved with lower intensity. Matching on step count controls for how much someone walks, but not for how they walk. A user with self-reported PEM who takes 5,000 steps does it slowly, with breaks, at low intensity. A non-PEM user with the same step count walks at a normal pace, with bursts, at moderate intensity. Same number of steps — very different cardiac load. Less load means less to recover from, so recovery looked “better” because the input was smaller.
.png?2026-05-29T14%3A54%3A56.996Z)
This is the activity confound. It calls into question published wearable-PEM comparisons that don’t control for activity intensity — not just step count, but actual cardiovascular demand. And it’s the reason we had to look somewhere else entirely.
Not how much — how predictably
The shift came from a change in question.
Instead of asking how much does this person recover (an average), we started asking how predictably does this person recover (a pattern over time).
Take two people, both walking about 4,000 steps a day, both with roughly the same average recovery metrics. Over 90 days, their averages look identical. But day by day, the picture is completely different.
The non-PEM person recovers about the same way every day. Monday looks like Tuesday. The body responds consistently.
The person who self-reports PEM recovers unpredictably. Monday is fine. Tuesday is a crash. Wednesday is okay. Thursday and Friday are crashes. Same average, but the day-to-day pattern is a lottery.
That instability — measured as the consistency of day-to-day recovery — is the distinguishing pattern.
That same day-to-day unpredictability is part of why a single morning's HRV or battery reading and how someone actually feels so often disagree — why your wearable and your feelings may disagree looks at that gap directly, including a practical rule for when the two don't match.
.png?2026-05-29T14%3A58%3A06.708Z)
Three independent patterns
When we analyzed 700,000 user-days across 2,029 users — controlling for activity level throughout — three independent physiological patterns emerged. Each distinguishes the self-reported PEM group from activity-matched non-PEM users, with statistically large effect sizes.
Recovery instability
How predictably recovery happens from one day to the next. A non-PEM body recovers about the same way every day. A body in the self-reported PEM group shows roughly twice the day-to-day spread — the same average recovery, but substantially different consistency.
Autonomic rigidity
How quickly the nervous system shifts gears after exertion. After physical effort, heart rate should drop sharply as the body switches from “work” to “rest.” This autonomic switching speed is a well-established physiological measure (Cole et al., 1999). In the self-reported PEM group, the switch is slower.
This was the most robust single pattern. It held up across all activity levels — from the most sedentary users to the most active, the signal remained large. It is not an artifact of walking less.
.png?2026-05-29T15%3A00%3A39.175Z)
Cardiac cost of movement
How much cardiac work each unit of walking costs. For the same walk, a person in the self-reported PEM group’s heart works roughly 50% harder than an activity-matched non-PEM user.
.png?2026-05-29T15%3A02%3A01.372Z)
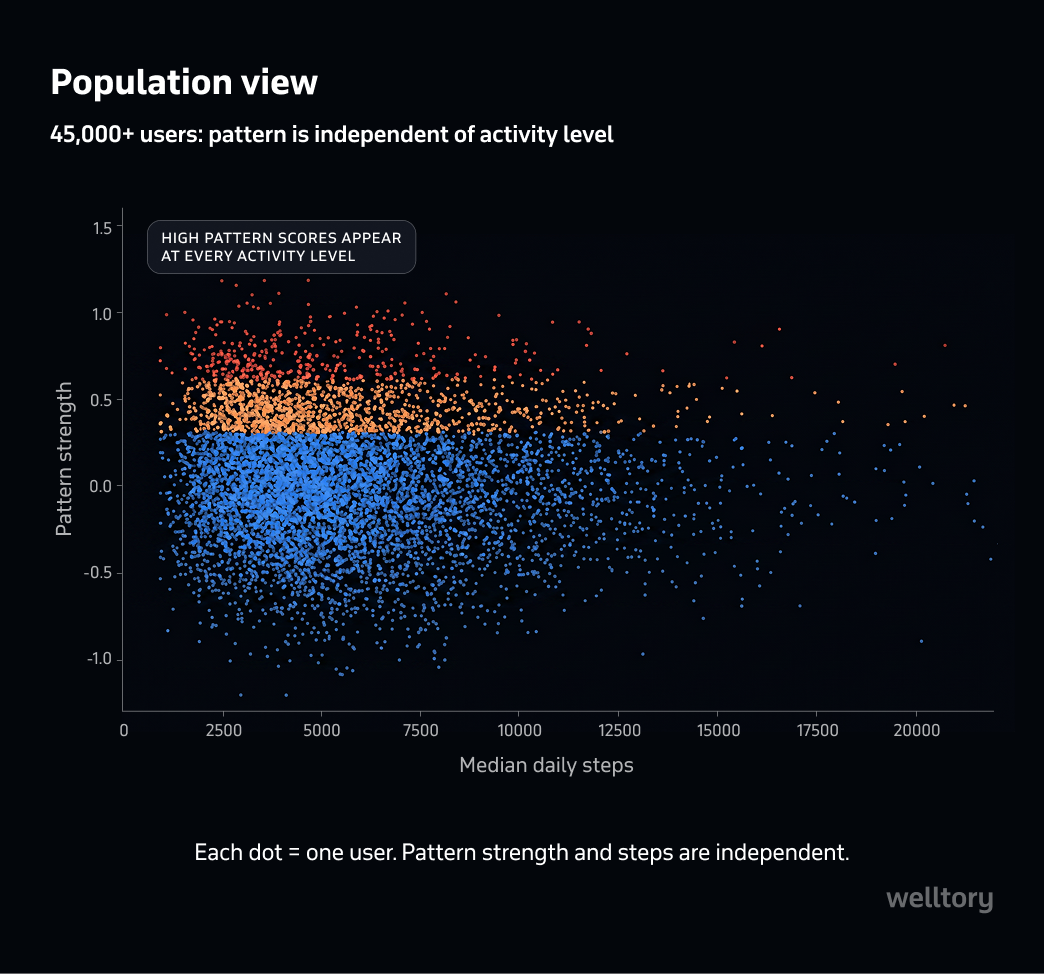
All three patterns showed statistically large effect sizes (Cohen’s d > 0.7), each from a different physiological system — recovery consistency, autonomic function, and cardiac efficiency. They are independent of each other and independent of activity level.
.png?2026-05-29T15%3A03%3A16.820Z)
Validation
Retrospective analysis at scale
The algorithm was applied retrospectively to anonymized historical data from more than 45,000 Welltory users. The model achieves a cross-validated AUC of approximately 0.77 on a heterogeneous self-reported cohort. For context, most published wearable-PEM models work with under 100 users and don’t control for the activity confound.
Dose-response relationship
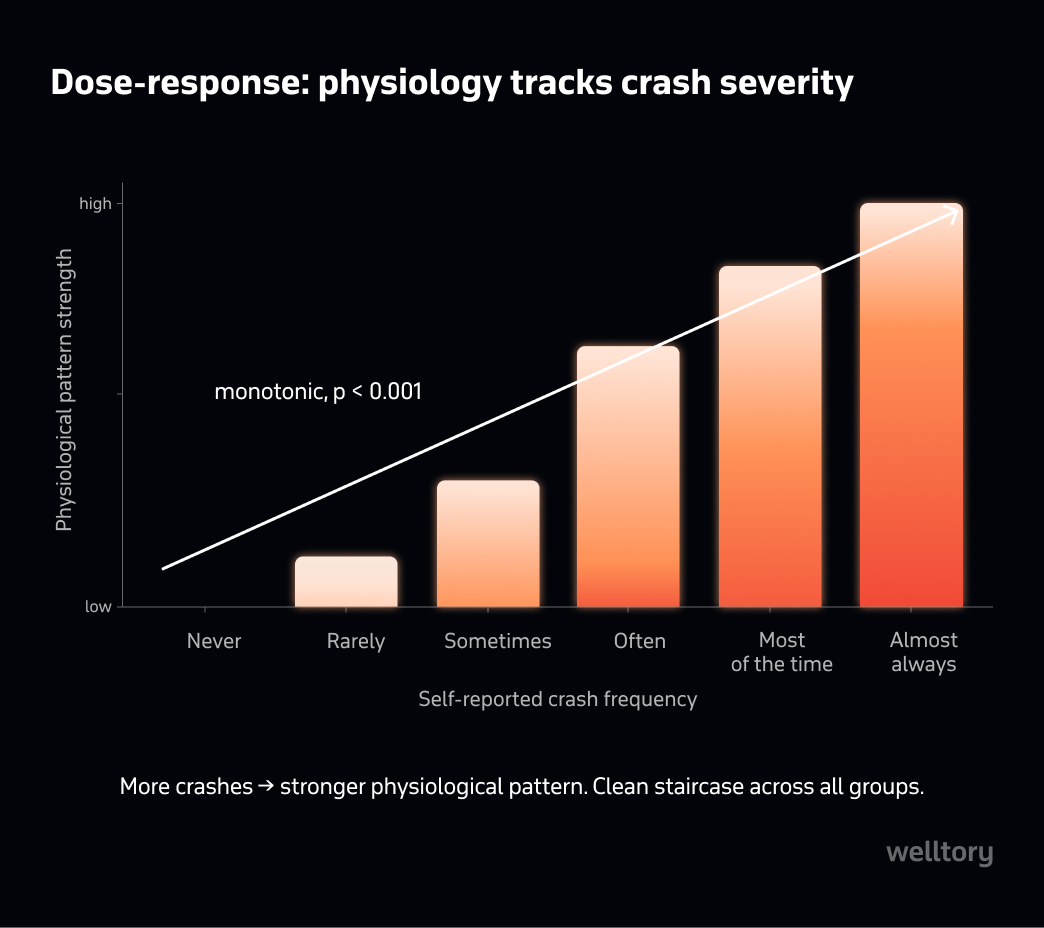
If the algorithm captured noise, there would be no relationship between how frequently someone reports crashes and how high their score is.
There is. We divided users into groups by self-reported crash frequency. Across all features and the composite score, crash frequency monotonically tracks the physiological score (p < 0.001). The more frequently someone reports crashes, the stronger the physiological pattern.
Minimal model performance
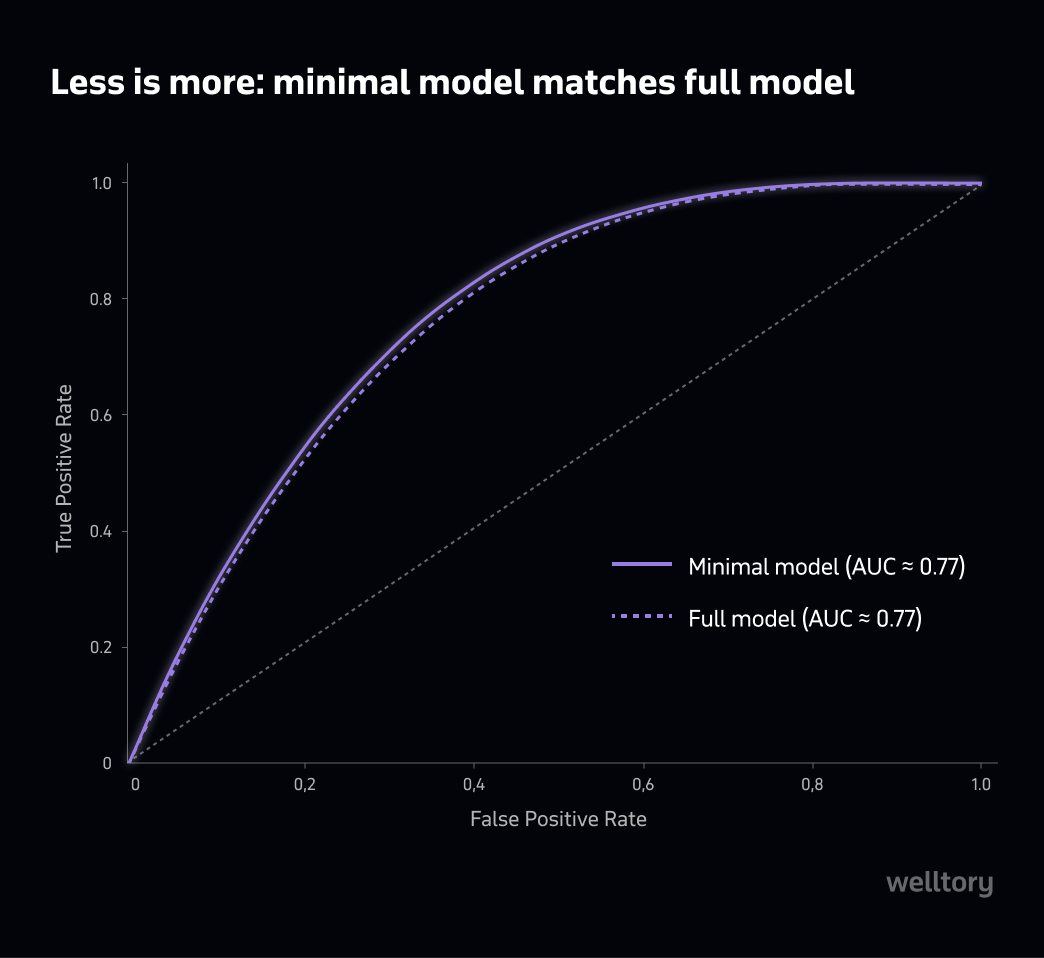
We tested models with over twenty features against a minimal model using just three — one from each pillar. The simpler model slightly outperformed the complex one (≈0.77 AUC in both cases). The signal is concentrated enough that additional features add noise, not information.
The cascade effect
A finding from our first research phase (N = 352) turned out to be one of the most notable observations.
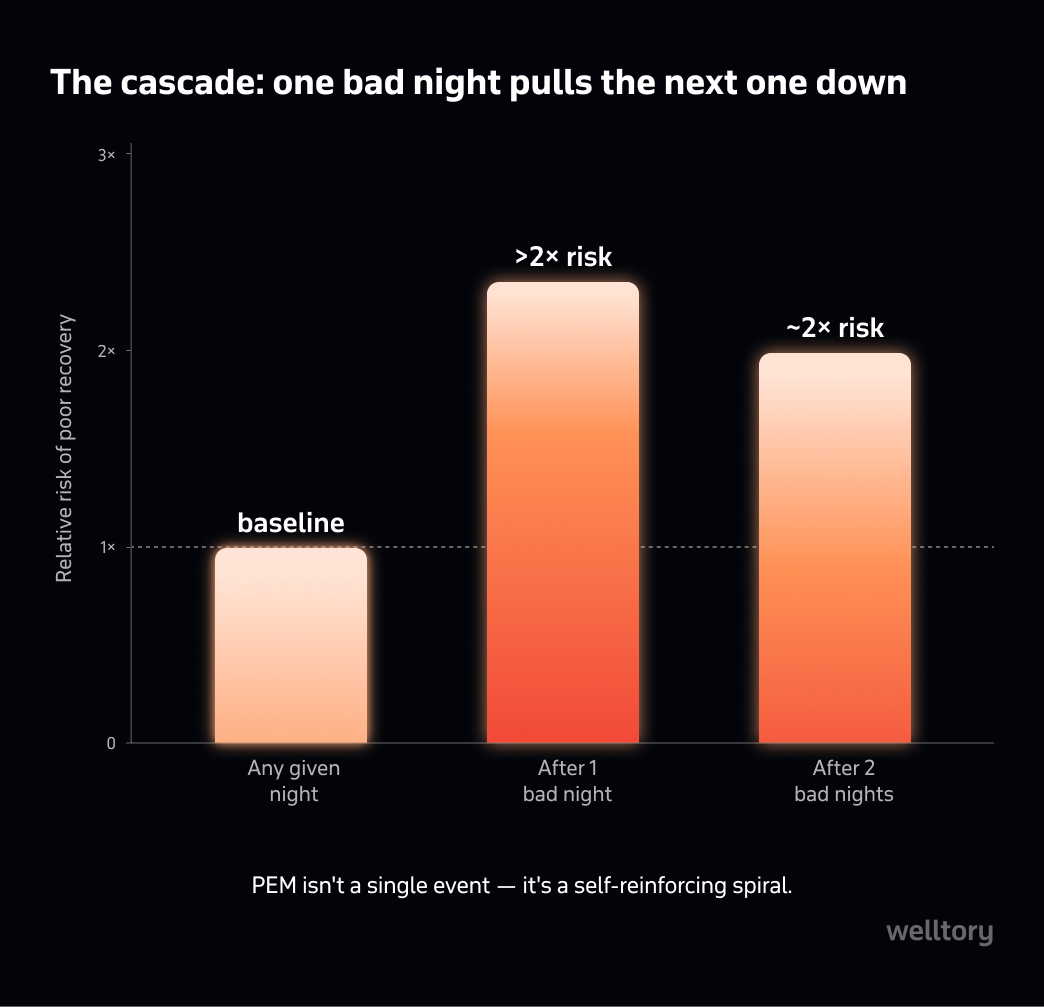
On any given night, about one in eight users has a poor recovery night. But if last night was poor, the probability of tonight being poor more than doubles. On day two, the risk is still elevated at roughly 2×.
Many people who report PEM describe this pattern: one bad day pulling the next one down. This cascade observation is consistent with the self-reinforcing nature of PEM described in the literature.
Validation in a self-identified ELC cohort
With consent from participants in Welltory’s community of users with self-reported energy-limiting conditions, we applied the algorithm to their anonymized wearable data. The community was recruited based on self-reported conditions — the algorithm played no role in participant selection.
Result: more than double the expected rate of elevated-risk scores compared to the general user population baseline. The majority of features pointed in the expected direction.
Population view
Do you know the expression "a whale of data"? That is what we see emerging in repositories of so-called "wellness gadgets". This "internal" study - we certainly need more of these! - has analyzed daily activity patterns of more than 45,000 Welltory users to extract patterns associated with self-reported post-exertional malaise, shortened as PEM. Smartly, this study subdivided the study participants into theirs "steps per day" quartiles. The results? Three measurable features that cannot be seen when all individuals are clumped together. Namely, consistency of the recovery, the speed of autonomic switching to lower gear, and the efficiency of the cardiac output showed up as independent predictors of the subsequent "crush" in each of the study groups. In people who crush more often, physiological patterns of cardiac underperformance were more consistent than in those who were less susceptible to PEM. In short, study shows that PEM does have a pathophysiological foundation. This paper should be seen by three categories of people: the medical doctors who regularly meet patients complaining about post-exercise malaise, the specialists in exercise physiology, and the patients themself, who now see that they are not alone, but members of a large group with similarly unusual body' responses. What's next? One should expect that the academic community will jump on this data and create a bunch of smaller, but well-controlled studies, slicing and dicing the PEM phenomenon in understandable and fixable clinical entities, specific to their underlying conditions, including POTS, Long-COVID, ME/ CFS and others.
Limitations and what this does not do
This is not a diagnostic tool. The algorithm identifies a statistical pattern more frequent in the self-reported PEM population. It does not diagnose ME/CFS, Long COVID, or any other condition. Clinical diagnosis requires a clinician.
It misses people. The algorithm prioritizes specificity — it would rather miss a self-reported PEM case than falsely flag a non-PEM user. At the stricter threshold, it misses more than half of self-reported cases. An absence of signal does not mean an absence of PEM.
Self-reported ground truth. The target population was identified through self-report: condition surveys, crash frequency reports, and Welltory’s internal health assessment labels. A subset had clinical research labels, but the majority are self-identified. Effect sizes should be interpreted in this context — the true effect in a clinically confirmed PEM population may differ.
Sample composition. Users are self-selected Welltory app users, predominantly wearing Apple Watch. Findings may not generalize to other wearable platforms or populations.
Severity spectrum is unknown. Users with severe or very severe ME/CFS who are unable to wear or charge a wearable device are not represented in this dataset. We do not know how these patterns behave across the full severity spectrum.
PEM-specific cohort. The self-reported PEM group was defined by users who specifically reported post-exertional malaise — not by umbrella diagnosis. Users were included regardless of their underlying condition (Long COVID, ME/CFS, fibromyalgia, POTS) provided they reported PEM as a symptom.
Not a universal threshold. Individual patterns vary. These are group-level statistical observations.
Implications for further research
The three physiological patterns identified here — recovery consistency, autonomic switching speed, and cardiac cost of movement — are derived from continuous heart rate data collected by consumer wearables. Several open questions remain for the research community:
Whether these patterns replicate in clinically confirmed cohorts, where diagnostic ground truth is available through validated instruments such as the DePaul Symptom Questionnaire or 2-day CPET.
Whether the activity confound described here explains a portion of the effect sizes reported in existing wearable-PEM literature. Studies that did not stratify by activity intensity may have measured fitness differences rather than PEM-specific patterns.
Whether the cascade effect — poor recovery predicting subsequent poor recovery — has clinical utility as a longitudinal monitoring signal, distinct from the cross-sectional patterns.
Whether menstrual cycle phase, which is known to affect autonomic function and recovery, acts as a modifier of these patterns.
Whether these patterns hold across a broader range of wearable devices and populations beyond the Welltory user base.
How this research was done
The algorithm described in this document is a research artifact and is not currently a feature of the Welltory application. This research was conducted on anonymized historical wearable data.
Welltory collects continuous heart rate, activity, and sleep data from consumer wearables, primarily Apple Watch. This research used anonymized data from 2,029 users with at least 60 days of recording, totaling over 700,000 user-days. Retrospective validation was applied to anonymized historical data from 45,484 users.
Ground truth definition. Users were classified as self-reported PEM based on two converging self-report sources: (1) condition self-identification surveys within the Welltory app (“Do you experience post-exertional malaise?”) and (2) crash frequency reports (ordinal scale: never → almost always). No source involved clinical diagnosis. The non-PEM comparison group comprised users with no self-reported energy-limiting condition.
Activity control. All analyses controlled for activity level by matching on daily step count and stratifying by activity quartile. This addresses the activity confound described in the document — the finding that naive comparisons measure activity differences, not PEM-specific patterns.
Features were developed to capture day-to-day variability and cardiac efficiency during activity, rather than absolute levels. The three-feature model (recovery consistency, autonomic switching speed, cardiac cost per step) achieved a cross-validated AUC of approximately 0.77 on the heterogeneous self-reported cohort.
This observation is made during IRB-approved research (Pearl IRB).
Conflict of interest. Welltory is a commercial organization. This research was conducted on data from Welltory’s own users, who requested that these findings be shared publicly. The algorithm described here is not a current product feature and will not become a paid feature.
References
Carruthers, B. M., et al. (2011). Myalgic encephalomyelitis: International Consensus Criteria. J Intern Med, 270(4), 327–338.
Cole, C. R., et al. (1999). Heart-rate recovery immediately after exercise as a predictor of mortality. NEJM, 341(18), 1351–1357.
Davenport, T. E., et al. (2019). Properties of measurements obtained during CPET in individuals with ME/CFS. Work, 66(2), 247–256.
Davis, H. E., et al. (2023). Long COVID: major findings, mechanisms and recommendations. Nat Rev Microbiol, 21(3), 133–146.
Jason, L. A., et al. (2015). Problems in defining post-exertional malaise. J Prev Interv Community, 43(1), 20–31.
Meeus, M., et al. (2013). Heart rate variability in patients with fibromyalgia and patients with chronic fatigue syndrome: A systematic review. Semin Arthritis Rheum, 43(2), 279–287.
National Academies of Sciences. (2015). Beyond ME/CFS: Redefining an Illness. Washington, DC.
Nelson, M. J., et al. (2019). Diagnostic sensitivity of 2-day CPET in ME/CFS. J Transl Med, 17(1), 80.
Nijs, J., et al. (2019). Evidence of altered cardiac autonomic regulation in myalgic encephalomyelitis/chronic fatigue syndrome. Medicine, 98(43), e17600.
Ruijgt, T., et al. (2025). Wearable heart rate variability monitoring identifies autonomic dysfunction and thresholds for post-exertional malaise in Long COVID. medRxiv, 2025.03.18.25320115.
Stevens, S., et al. (2018). CPET methodology for assessing exertion intolerance in ME/CFS. Front Pediatr, 6, 242.
Van Cauwenbergh, D., et al. (2014). Malfunctioning of the autonomic nervous system in patients with chronic fatigue syndrome. Eur J Clin Invest, 44(5), 516–526.
May 2026. Welltory Research. This is observational research; no clinical intervention was tested. Findings represent statistical patterns in aggregate data and should not be interpreted as diagnostic for any individual. Consult a qualified healthcare provider for medical concerns.
Was this helpful?
Ask AI for a summary of page


Written by Jane Smorodnikova
The founder and CEO of Welltory. A recognized tech leader with two Master's degrees and experience at MIT, she has scaled Welltory to over 17 million users.
Reviewed by Prof. Ancha Baranova
Systems biologist and geneticist specializing in functional genomics, metabolism, and aging; a prolific researcher and widely recognized science communicator.

